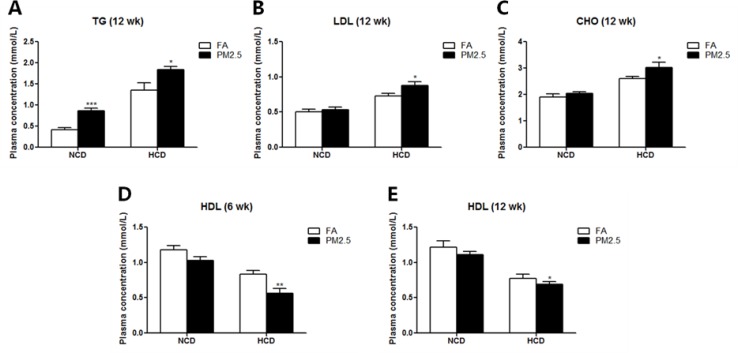
Figure 3. Effects of PM2.5 exposure on blood lipids.
TG (A), LDL (B), CHO (C) levels after 12 weeks of PM2.5 exposure, and HDL level after 6 (D) or 12 (E) weeks of PM2.5 exposure are shown. The level of TG was significantly elevated after 12 weeks of PM2.5 exposure as compared to the FA group in both normal chow diet and high-cholesterol diet group (A). Twelve weeks of PM2.5 exposure significantly elevated the levels of LDL and CHO in the high-cholesterol diet group (B, C). Both 6 and 12 weeks of PM2.5 exposure decreased the level of HDL in the high-cholesterol diet group (D, E). Values are mean ± SE (n = 9). *p < 0.05, **p < 0.01 and ***p < 0.001 as compared to the FA group.

