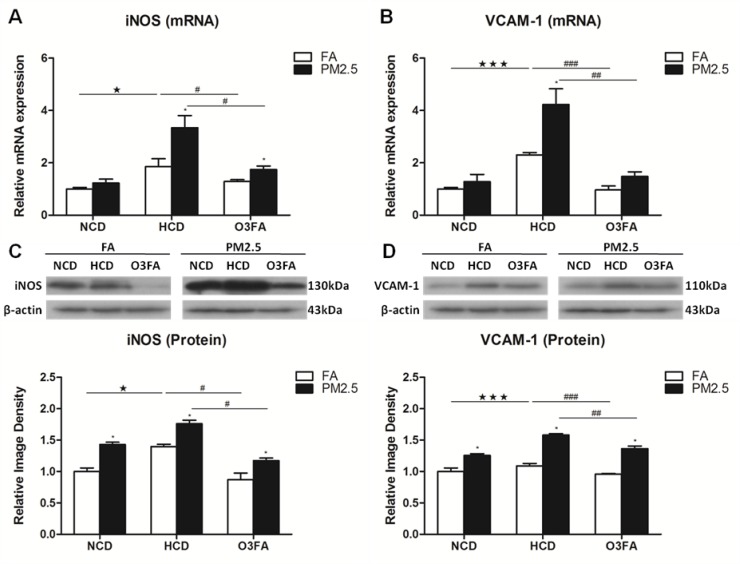
Figure 7. Effects of PM2.5 exposure on the expression of VCAM-1 and iNOS in brain microvessels.
The mRNA expression of iNOS (A) and VCAM-1 (B) and protein levels of iNOS (C) and VCAM-1 (D) after 12 week PM2.5 exposure were detected by Real-time PCR and Western blot analyses, respectively. Values are represented as mean ± SE (n = 6). *p < 0.05 as compared to the FA group; ★p < 0.05, ★★★p < 0.001 as compared to the normal chow diet group; #p < 0.05, ##p < 0.01 and ###p < 0.001 as compared to the high-cholesterol diet group.

