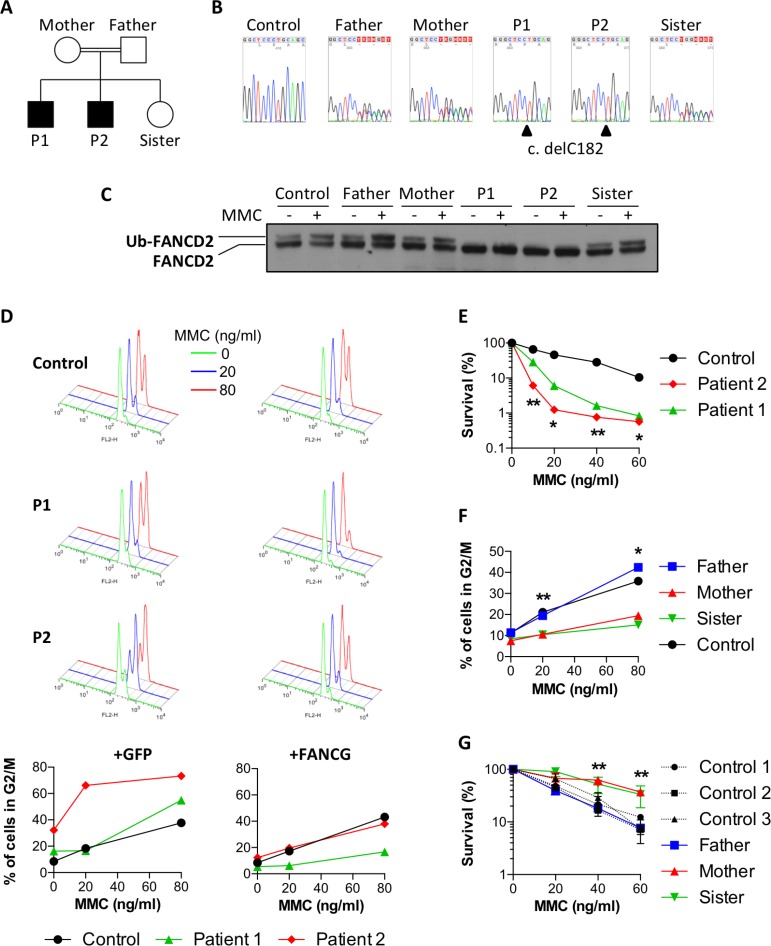
Figure 1. Attenuation of MMC sensitivity in a family with Fanconi anemia.
(A) Pedigree of the family. Black boxes indicate the two FA patients. (B) Sanger sequencing showing delC182 in FANCG found to be homozygous in P1 and P2, and heterozygous in the parents and the healthy sister. (C) FANCD2 immunoblot performed with fibroblasts exposed or not to 150 ng/ml MMC for 18 h. (D) Primary fibroblasts from a healthy control and from patients P1 and P2 were transduced either with GFP (left panels) or with wild-type FANCG (right panels) containing vectors. The upper histograms show cell cycle analysis of cells treated for 48h with 0, 20 or 80 ng/ml MMC (green, blue and red histograms respectively). The percentages of cells in G2 phase are plotted on the bottom panels. (E) Cell survival of P1, P2 and a healthy control in presence of increasing doses of MMC. Results shown as mean ± SD of triplicates are representative of 3 independent experiments. Statistical analyses were performed using unpaired t-tests.(F) Percentages of primary fibroblasts from the father, mother, sister, and a healthy control accumulating in G2 phase 48 h after treatment with the indicated doses of MMC. Results are representative of 3 independent experiments. Statistical analyses were performed using unpaired t-tests comparing the mean of the mother and sister versus the mean of the father and control. (G) Cell survival of the father, mother, sister and 3 healthy controls in presence of increasing doses of MMC. Results shown as mean ± SD of triplicates are representative of 3 independent experiments. Statistical analyses were performed using unpaired t-tests comparing the mean of the mother and sister versus the mean of the 3 controls. *P < 0.05, **P < 0.01, ***P < 0.001.

