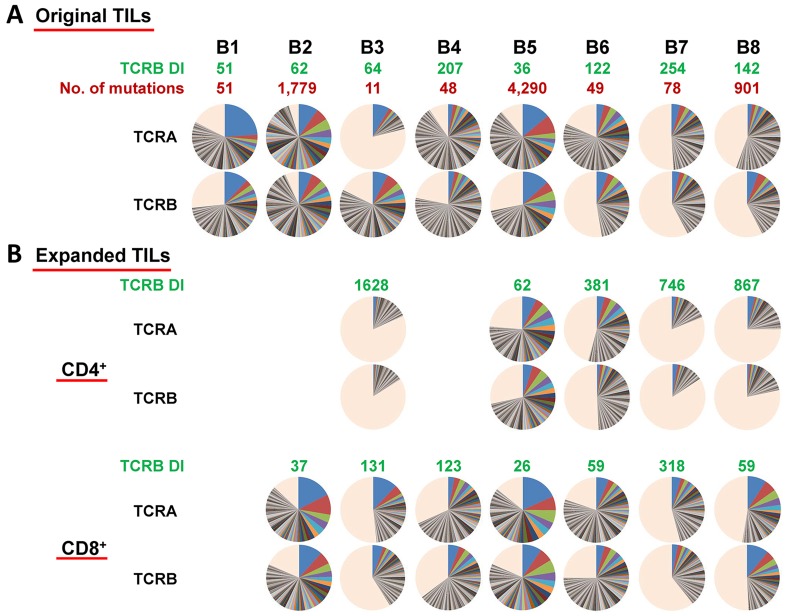
Figure 2.
(A) Distribution of both TCR-α and TCR-β CDR3 unique clonotypes, the numbers of mutations in individual tumors as well as TCR-β DIs in original TILs in SCCHN tumors. (B) Distribution of both TCR-α and TCR-β CDR3 unique clonotypes and TCR-β DIs in expanded CD4+/CD8+ TILs. Pie charts depict clonotypes with 0.1% frequency or higher in each patient. Common colors among different pie charts do not represent identical clonotypes. The light orange portion of each pie chart contains clonotypes with less than 0.1% frequency.

