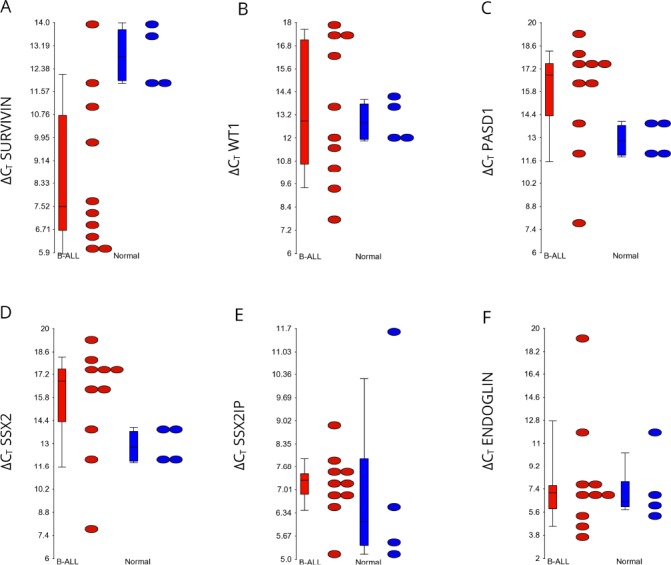
Figure 2. Relative expression of transcripts encoding each antigen in the B-ALL patients compared to the healthy volunteers.

Dots indicate the ΔCT values, whereby the CT of the endogenous control GAPDH is subtracted from the CT of each gene. Genes that were not expressed were assigned a CT value of 40. The higher the ΔCT value, the less antigen was expressed. All ΔCT values for antigens were lower level than the reference gene GAPDH. Streaked dots, representing patient sample ALL004, were outliers that do not represent antigen expression. P-values were determined using a two-way ANOVA test. Ns, not significant.
