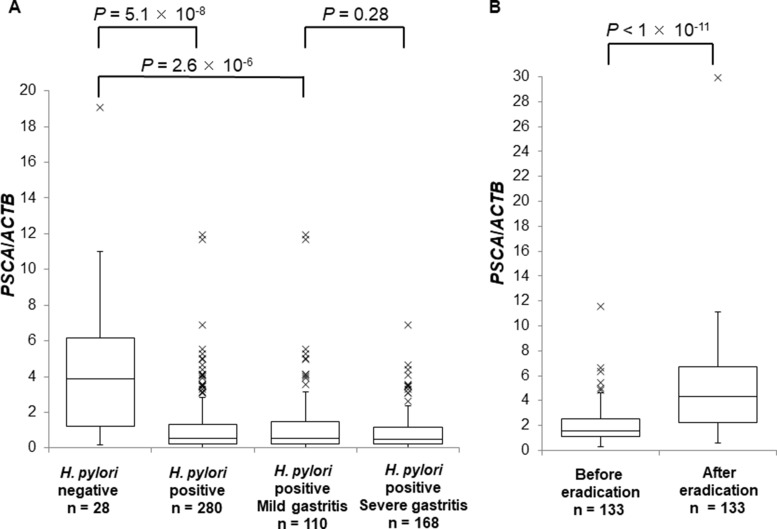
Figure 2. The suppression of PSCA expression by H. pylori infection.
Box-plots with medians for PSCA expression normalized to ACTB in biopsy samples of gastric mucosa. (A) PSCA mRNA in H. pylori-negative controls (n = 28), in H. pylori-infected patients (n = 280), in H. pylori-infected mild gastritis patients (n = 110), or in H. pylori-infected severe gastritis patients (n = 168). The P values were calculated by a Mann-Whitney U test. (B) The comparison of the expression levels of PSCA in each individual patient (n = 133) before and after H. pylori eradication. The P value was calculated by a Wilcoxon signed rank test.

