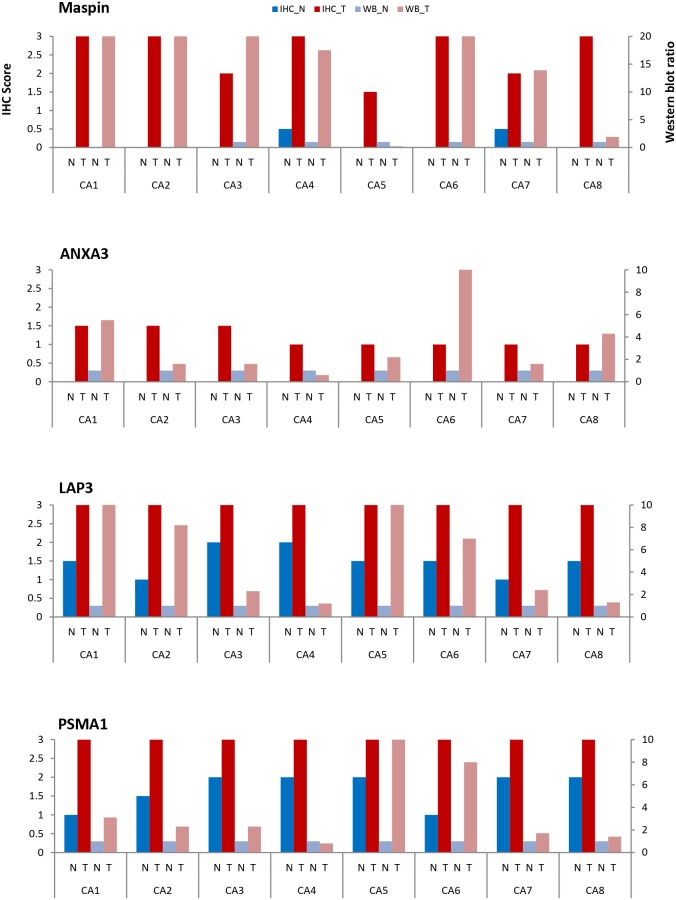
Figure 8. Comparison of maspin, ANXA3, LAP3, and PSMA1 expressions by IHC and Western blotting in 8 patients.
Normal (N) and tumor (T) colon tissue pairs from 8 patients (CA1-CA8) are examined. Paired tissue were examined by IHC (normal tissue – dark blue; tumor tissue – dark red). Protein extracts were examined by Western blotting (normal – light blue; tumor – light red). Expressions were scored according to the average staining intensity on a 0-3 scale for IHC (left Y axis) and a 0-10 expression ratio scale for Western blotting (right Y axis), with normal tissue scaled to 1.

