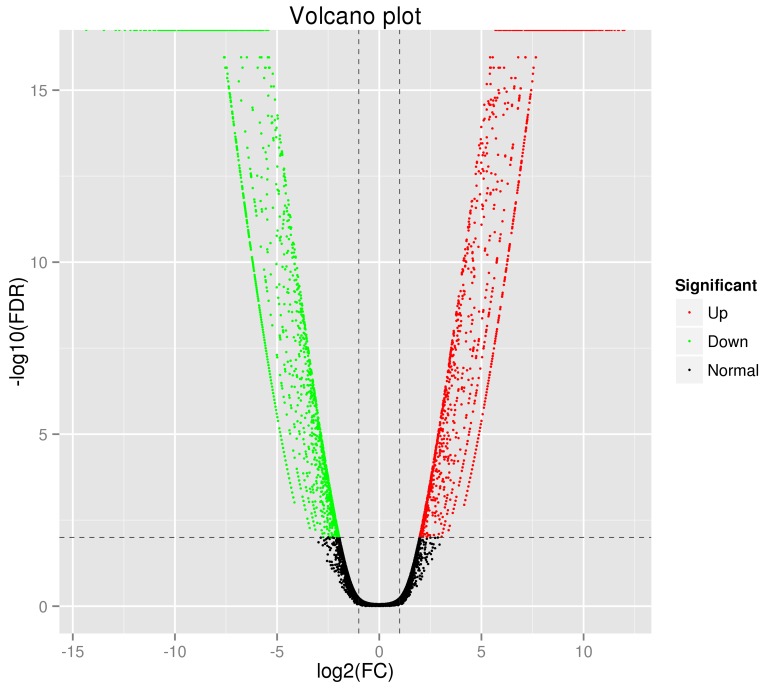
Figure 3. Distribution of the differentially expressed genes shown as a volcano plot.
Each point represents a gene. The green dots represent the down-regulated differentially expressed genes, red dots represent the up-regulated differentially expressed genes, and black dots represent non-differentially expressed genes.

