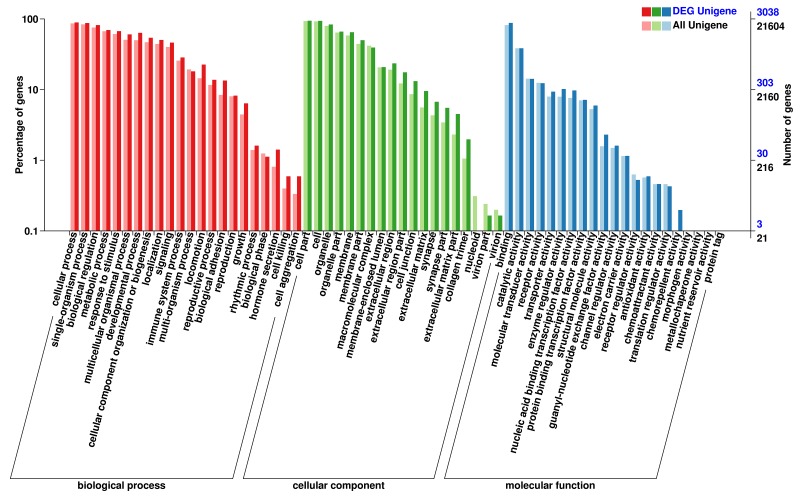
Figure 4. GO enrichment analysis of the DEGs.
The horizontal axis shows the secondary nodes of three categories in GO. The vertical axis displays the percentage of annotated genes versus the total gene number. The dark color columns display annotation information of the total genes and the light color columns represent annotation information of the differentially expressed genes only.

