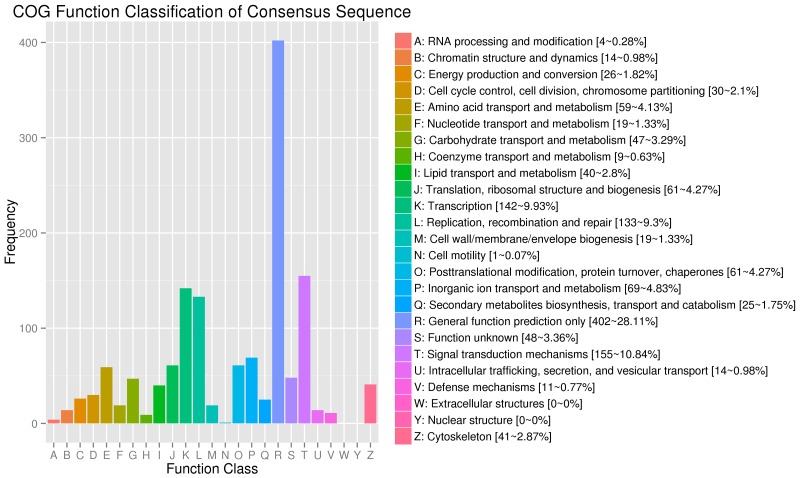
Figure 5. COG function classification of the annotated DEGs.
938 annotated DEGs are distributed into 25 COG functional categories. The COG categories are shown on the horizontal axis and gene numbers and proportions are plotted on the vertical axis. COG function classification of the annotated DEGs. 938 annotated DEGs are distributed into 25 COG functional categories. The COG categories are shown on the horizontal axis and gene numbers and proportions are plotted on the vertical axis.

