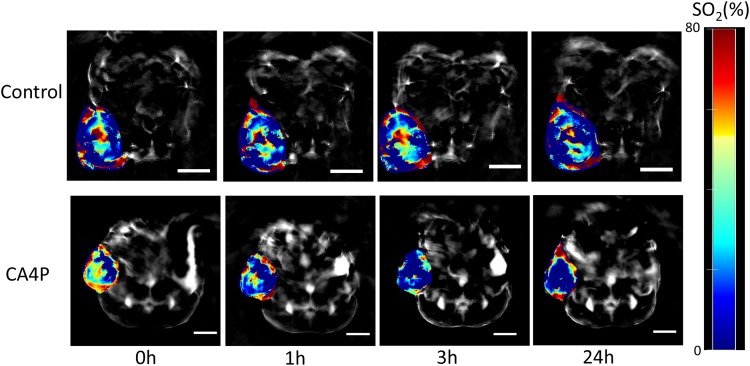
Figure 1. MSOT images of lung xenograft tumor at different time points (0h, 1h, 3h, and 24h) post-saline (control) or CA4P (120 mg/kg, IP) administration.
Red colour corresponds to higher concentration of oxyhemoglobin and blue colour represents either higher concentration of deoxyhemoglobin or an area where there is no blood present. Percentage of hemoglobin saturation (%SO2) was calculated as %SO2 = [HbO2/(HbO2+Hb)]*100. Paired Student’s t-test showed that the changes in %SO2 at 1h and 3h post-CA4P administration, compared to 0h, were statistically significant in tumor periphery (1h: p value <0.005, n=6; 3h: p value <0.05, n=4; 24h: not significant, n=4). The changes in %SO2 at 1h, 3h, and 24h post-CA4P administration, compared to 0 h, were statistically significant in tumor center (1h: p value <0.05, n=6; 3h: p value <0.05, n=4; 24h: p value <0.05, n=4). The variations in %SO2 in control tumors were of no statistical significance (n=4 for all time points), scale bar: 5 mm.

