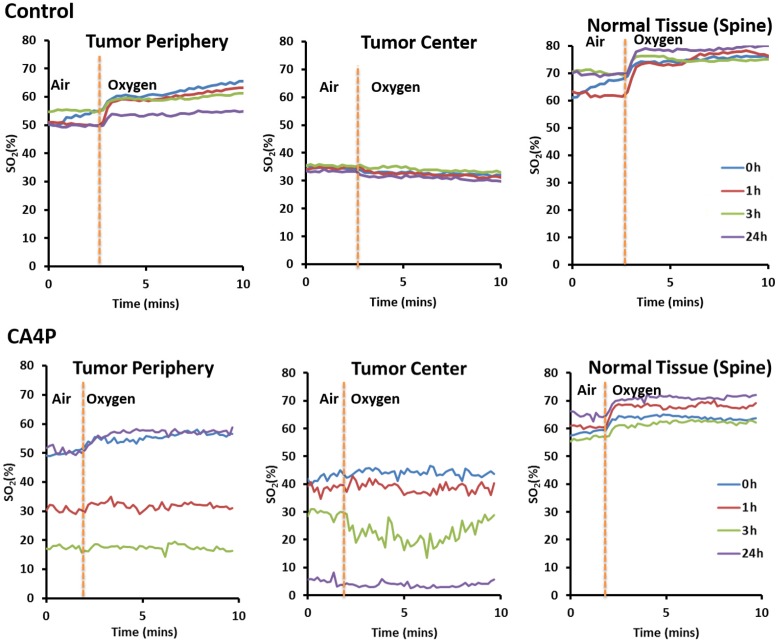
Figure 2. Graph showing change in blood oxygenation level at different time points (0h, 1h, 3h, and 24h) after administration of saline (control) or CA4P (120 mg/kg, IP) in different sections of tumor (tumor periphery and tumor center) compared to healthy tissue (spine).
Percentage of hemoglobin saturation (%SO2) was calculated as %SO2 = [HbO2/(HbO2+Hb)]*100. Mice breathed air initially, and then the inspired gas was changed to oxygen.

