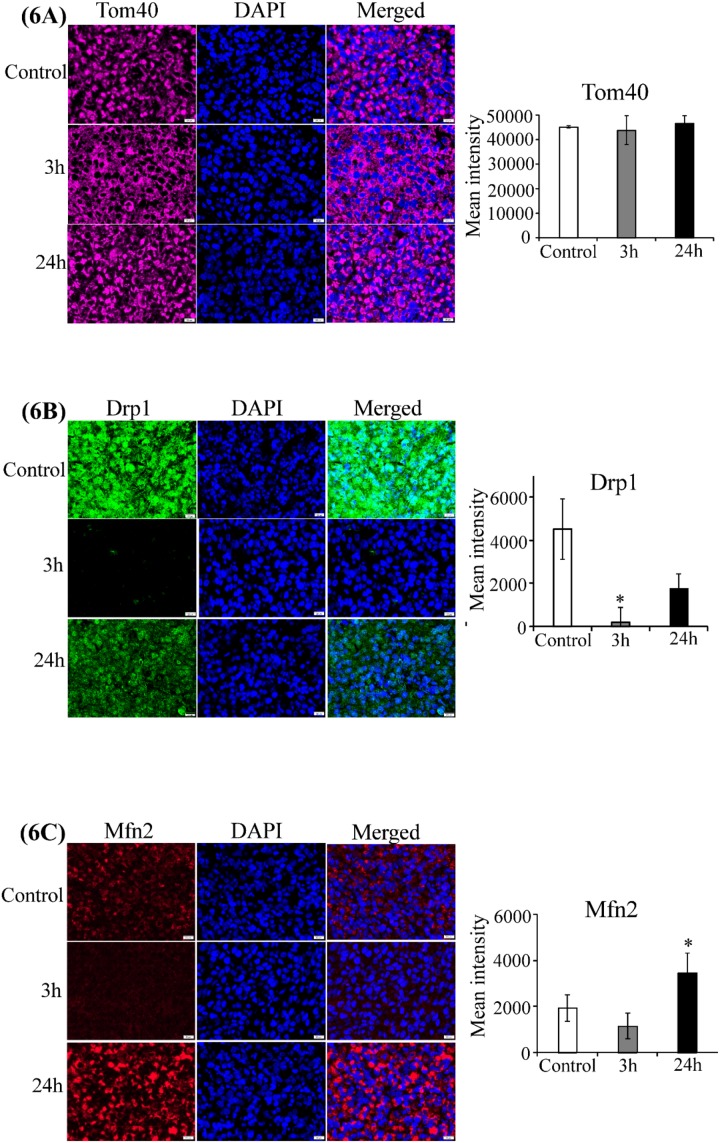
Figure 6. CA4P treatment does not disrupt mitochondrial function.
Representative images of CA4P-treated, fluorescent immunohistochemically stained paraffin sections of subcutaneous xenograft tumors including untreated control (Row 1), 3 hours post-CA4P (Row 2), and 24 hours post-CA4P (Row 3). Bar graphs indicate the quantification of mean grey intensity. Data are presented as mean ± SEM (n=10, *p value < 0.05; **p value < 0.005; scale bar, 20 μm). (A) Tom40 is unaffected by CA4P treatment. Anti-Tom40 antibody (cyan), DAPI for nuclei (blue), and merged image (cyan and blue). (B) Drp1 is reduced 3 and 24 hours post-treatment. Anti-Drp1 antibody (green), DAPI for nuclei (blue), and merged image (green and blue). (C) Mfn2 is enhanced at 24 hours post-treatment. Anti-Mfn2 antibody (red), DAPI for nuclei (blue), and merged image (red and blue).

