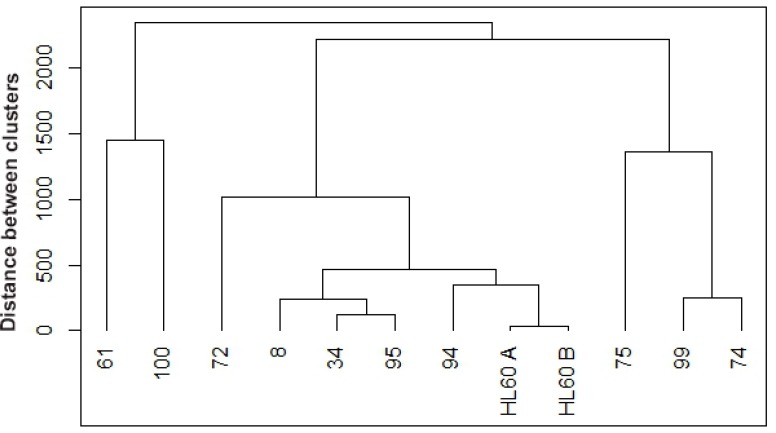
Figure 3. Hierarchical clustering between untreated de novo and HL-60 samples based on cluster of differentiation (CD) markers.
Untreated samples were clustered using R based on CD34, CD38, CD11b, CD14, and CD15 expression. Agglomerative hierarchical clustering analysis was performed using the complete linkage method. De novo AML 94 (wt-NPM1) clusters closest with HL-60 cell line (wt-NPM1), the next closer clusters occur at various distances with 7 mut-NPM1samples (AML 8, AML 34, AML 95, AML 72, AML 75, AML 99, AML 74) and then the furthest clusters occur with two wt-NPM1 (AML 61 and AML 100).

