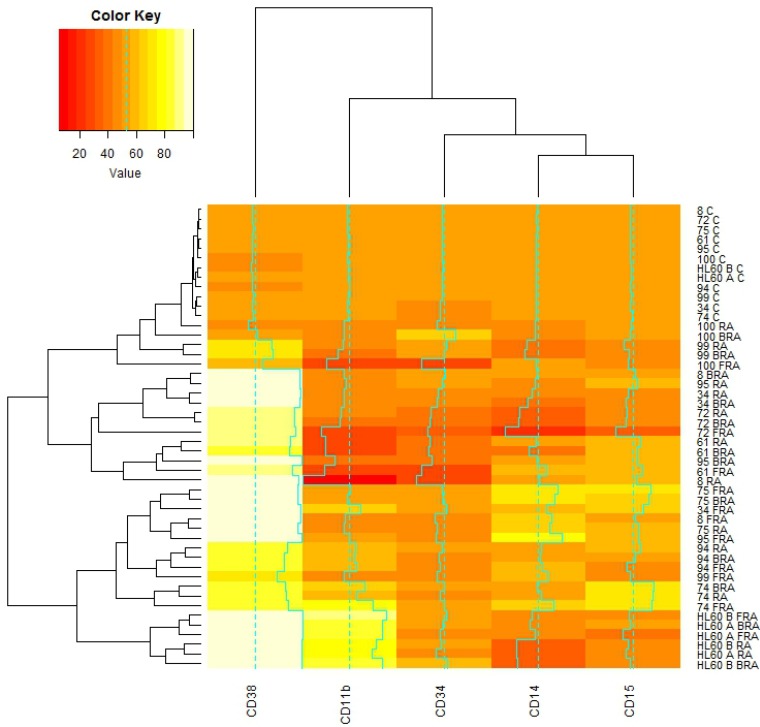
Figure 4. Global correlations of cluster of differentiation markers with samples and treatments.
De novo and HL-60 samples, untreated or RA, FRA, BRA treated for 72 h were assessed for CD34, CD38, CD11b, CD14, CD15 by flow cytometry. The gates were set to 50% of the population positive in untreated samples, and 50% expression is color coded orange. With treatment, the expression of each assessed marker is upregulated (values color coded yellow to white) or downregulated (values color coded with red shades). The correlations of mean expression of those markers for each subject under each treatment were analyzed using the heatmap.2 function available in the gplots package for R.

