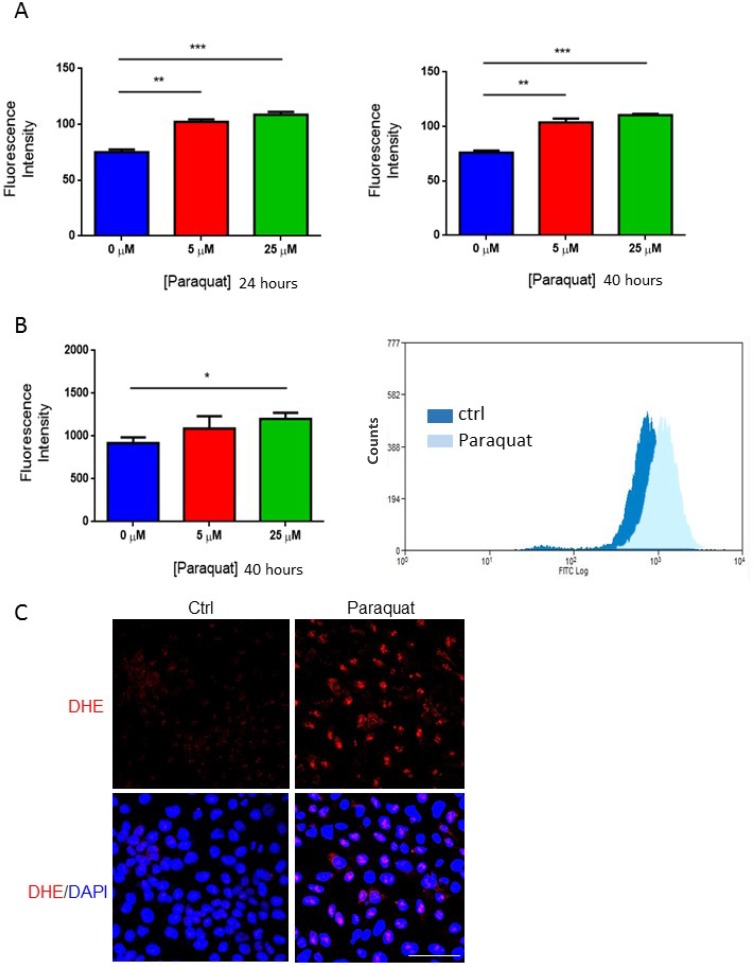
Figure 1. Paraquat increases ROS level in NT2 cells.
(A) Cells were treated with paraquat at the indicated concentrations for 24 hours (left panel) and 40 hours (right panel). Chloromethyl-H2DCFDA dye was used to measure ROS level using spectrometry. Bar: mean ± SEM; **p < 0.01, ***p < 0.001. (B) Cells were treated with paraquat for 40 hours. ROS level was assessed by staining with chloromethyl-H2DCFDA, and fluorescence intensity was monitored by flow cytometry. Bar: mean ± SEM; *p < 0.05. (C) Cells treated with 25 μM paraquat were stained with dihydroethidium (DHE) to visualize the induction of ROS. Scale bar: 100 μm.

