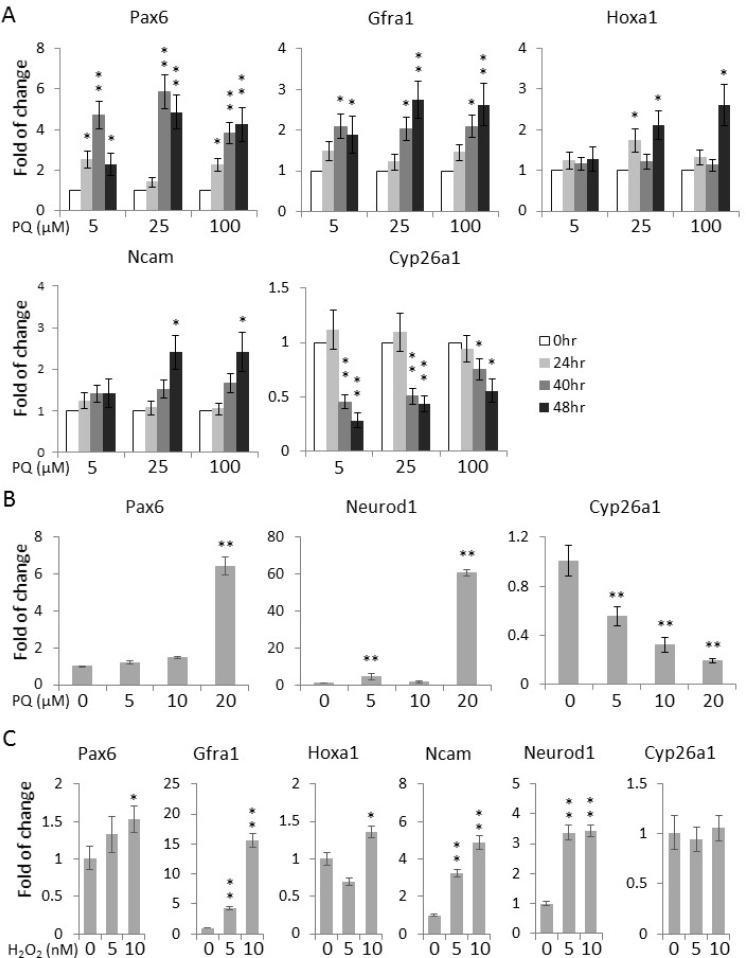
Figure 4. Paraquat induces the expression of neuronal markers in NT2 cells.
(A) Cells were treated with paraquat for different durations. qPCR was performed to measure the time-dependent expression of neuronal markers. (B) Cells were treated with indicated concentrations of paraquat for two days. The dose-dependent expression of neuronal transcription factors (Pax6 and NeuroD1) and Cyp26a1 was quantified by qPCR. (C) Cells were treated with H2O2 at different concentrations for two days and analysed by qPCR for the transcript levels of neuronal marker genes. Bar: mean ± SD; *p < 0.05, **p < 0.01 by Student t-test.

