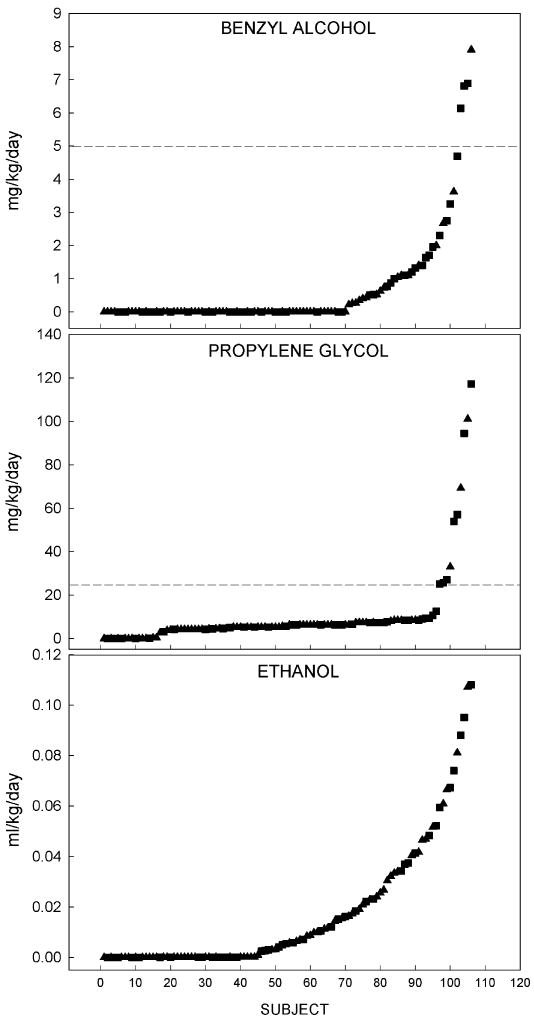
Figure 1. Median Daily Excipient Exposure.
Daily median exposure to each excipient for all subjects in the cohort shown in order of increasing exposure. Triangles denote females and squares show males. Dashed lines show acceptable daily intake levels for adults for BA and PG determined by the Joint Food and Agriculture Organization of the United Nations and the World Health Organization Expert Committee on Food Additives.

