


Fig. 4.
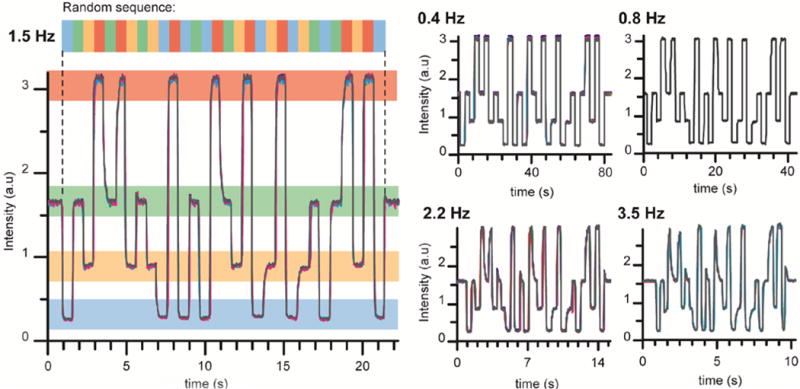
Frequency characterization. Left: A sequence of pressure commands was applied at 1.5 Hz to the chemical inlets. Each chemical is labeled with different concentrations of fluorescein. For visualization purposes, we represented each level of fluorescence corresponding to a different reagent with a different colour. The intensity is monitored in a region of interest located next to the animal’s nose. Right: Intensities collected for the same command of pressure sequence at different frequencies: 0.4, 0.8, 2.2, and 3.5 Hz.