


Fig. 5.
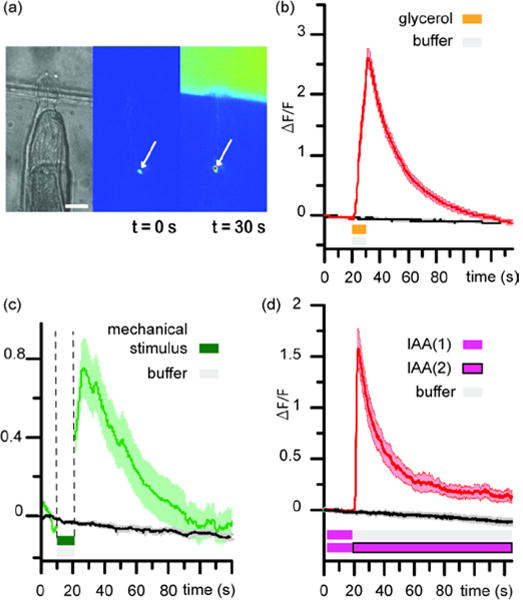
Control experiments demonstrating that no artefact is introduced during platform operation. (a) Photographs of an animal’s head trapped at the junction: bright-field (left), fluorescence imaging (middle and right). Baseline of ASH sensory neuron expressing GCaMP calcium reporter is visible in the middle photograph and upon stimulation with 1 M glycerol solution, ASH appears brighter (right). Scale bar is 25 μm. (b) Average calcium response of ASH upon stimulation with 1 M glycerol solution labeled with FITC at 1 mM concentration (red curve) or with S-basal buffer with FITC at 1 mM concentration (black curve). (c) Average calcium response of ASH upon buffer-buffer with FITC stimulation (black curve) and upon deliberate mechanical stimulation using a different device with on-chip valves (green curve). (d) Average response of AWC upon switch of 1 mM IAA to buffer (red curve) or a switch of 1 mM IAA to a separate stream of 1 mM IAA (black curve). Shaded area indicates SEM. n =10 for each assay.