


Fig. 6.
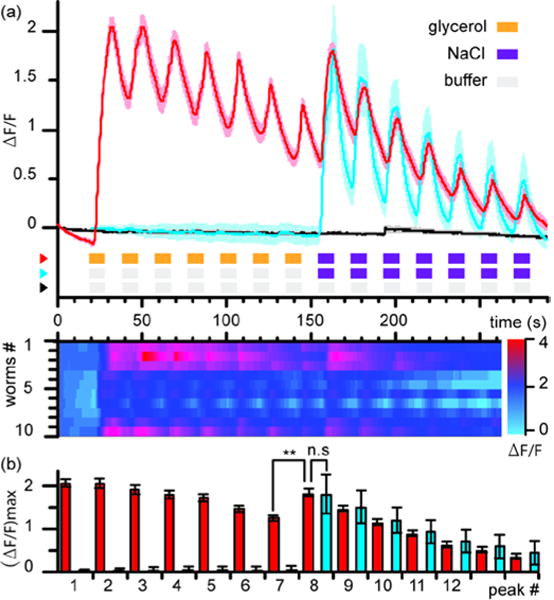
Neuronal activity of ASH upon multichemical stimulation with second-long pulses. (a) Top: Average calcium response upon repetitive stimulation with 1 M glycerol solution followed by repetitive stimulation with 0.5 M NaCl solution (red curve). Average response upon repetitive stimulation with buffer-buffer followed by repetitive stimulation with 0.5 M NaCl solution (blue curve). Average response upon repetitive stimulation with S-basal buffer (black curve). Shaded areas indicates SEM. Bottom: single traces for each animal for the glycerol-NaCl experiment. (b) Average peak value of calcium rises after each stimulus for the glycerol-NaCl experiment (red) or the buffer-NaCl control experiment (blue). Peak 7 and Peak 8 for the glycerol-NaCl experiment (red) show a significant difference (**, p = 0.002, Wilcoxon-signed rank test). n =10 for each assay.