
Fig. 7.
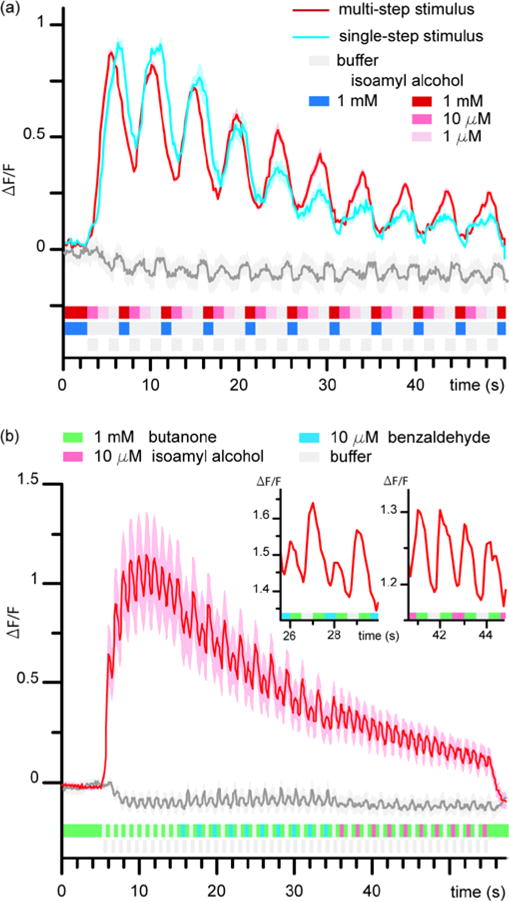
Neuronal activity of AWC neuron upon different stimuli patterns (a) Comparing AWC neuronal activity from binary switching of 1 mM isoamyl alcohol (IAA) to buffer (blue curve), a sequential stepping from 1 mM IAA, 10 μM IAA, 1 μM IAA, and buffer (red curve), and a buffer to buffer switching control (grey curve) at 1 Hz. (b) AWC Neuronal activity tracking multiple chemicals at 2 Hz. Alternation of butanone, benzaldehyde, IAA, and buffer shown in red curve, alternation of buffer to buffer shown in grey curve. n =10 for each assay.