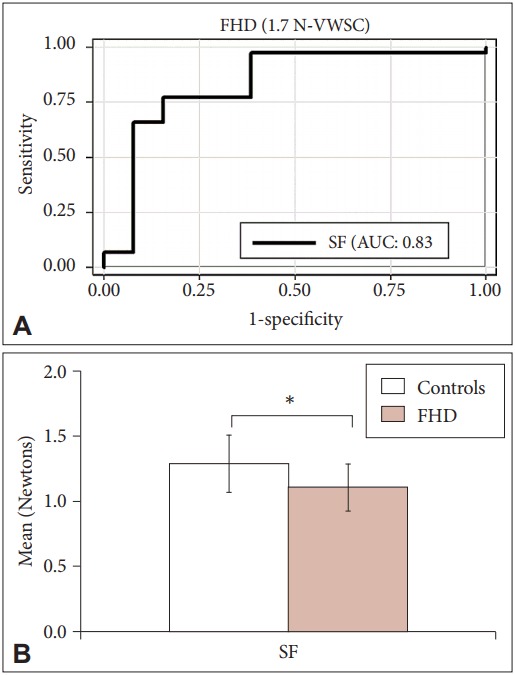
Figure 3.

A: A single parameter, namely, SF, in the ROC curve, which improved diagnostic accuracy of HCs and patients with FHD under the 1.7 N VWSC. B: Shown is the comparison of SF between HCs and patients with FHD under the 1.7 N under VWSC. The SF applied by dystonia patients (1.1 N) was below the estimated cut-off of 1.2 N. SF is represented in N. *p < 0.001. SF: slip force, ROC: receiver operating characteristic curve, HCs: healthy controls, FHD: focal hand dystonia, VWSC: very wet skin condition, N: Newtons, AUC: area under curve.
