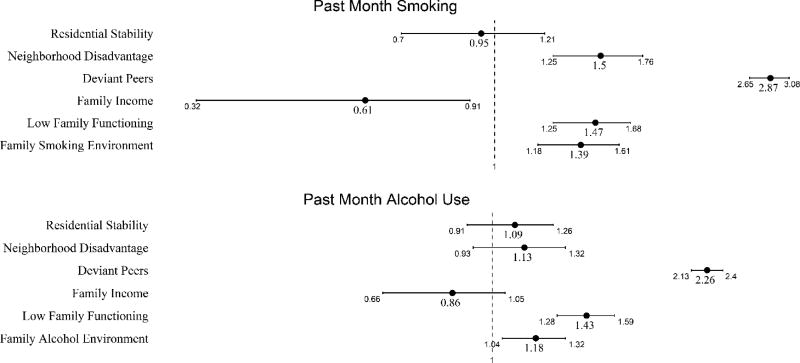
Figure 2.
Odd ratios (ORs) and 95% confidence intervals (CIs) for neighborhood, family, and peer factors predicting past month smoking and alcohol use from grades 5 to 9 after controlling for average growth in smoking and alcohol use. Estimates are conditional on sociodemographic differences in overall intercept and slope of smoking and alcohol use. Each OR indicates that a one standard deviation increase in the predictor corresponds to an increase or decrease in the odds of increased smoking or alcohol use across grades 5 through 9. The x-axis is presented on the log scale and CIs that include 1 indicate a non-statistically significant association.

