
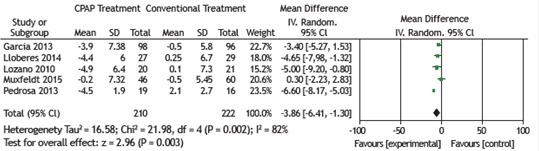
Figure 3. Forest plot of the mean change in diastolic blood pressure as assessed by 24-h ambulatory blood pressure monitoring and its 95% CI.
Official websites use .gov
A
.gov website belongs to an official
government organization in the United States.
Secure .gov websites use HTTPS
A lock (
) or https:// means you've safely
connected to the .gov website. Share sensitive
information only on official, secure websites.