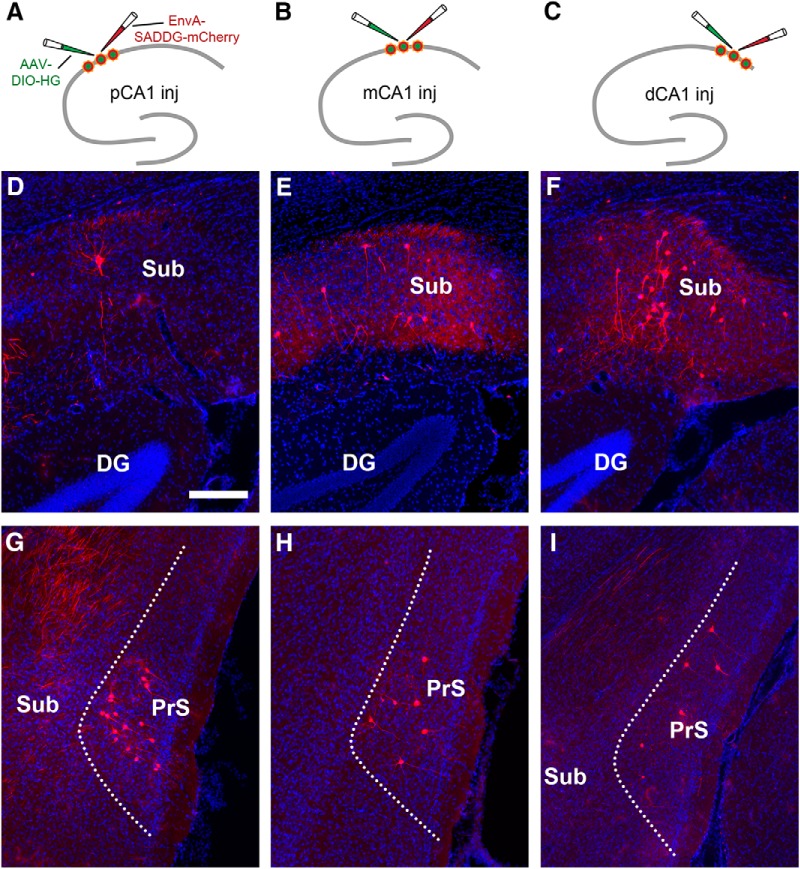
Figure 4.
The subiculum strongly projects to distal CA1 while the presubiculum strongly projects to pCA1, thus showing opposing proximal-distal connectivity gradients. A–C, Schematic illustrations rabies tracing from proximal CA1 (pCA1, A), intermediate CA1 (mCA1, B), and distal CA1 (dCA1, C), respectively. D–F, Rabies labeled CA1-projecting subicular neurons in example cases following the injection in pCA1 (D), mCA1 (E), and dCA1 (F), respectively. The scale bar (200 μm) in D applies to all other panels. G–I, Rabies-labeled CA1-projecting presubicular neurons in example cases following the injection in pCA1 (G), mCA1 (H), and dCA1 (I), respectively. Also see Fig. 4-1.

