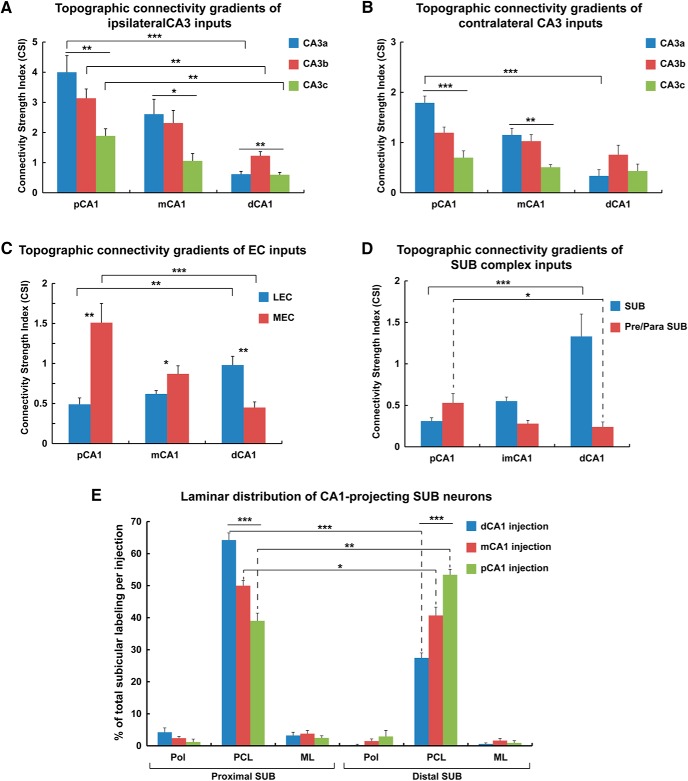
Figure 6.
Quantitative analyses of proximal-distal connectivity gradients of canonical CA3/EC and noncanonical subiculum complex inputs to CA1 subfields. A, A quantitative summary shows input strength differences of canonical CA3 subregion (CA3a, CA3b, and CA3c) inputs to proximal CA1, intermediate CA1, and distal CA1, respectively. The data are plotted with the values of the connectivity strength index (CSI), defined as the number of presynaptic neurons in a specific brain region divided by the number of starter neurons in the injections site. The data show complementary gradually significant decreases from strong CA3a–c connectivity to proximal CA1 to progressively weaker connectivity for CA3a–c to intermediate CA1 and distal CA1. These complementary decreases show systematically strong-to-weak connectivity along the proximal-distal axis of CA1. Group comparisons performed using one-way ANOVA with Tukey post hoc tests. The data are presented as mean ± SE; *, **, and *** indicate the statistical significance levels of p < 0.05, 0.01, and 0.001, respectively. B, A quantitative summary shows gradient-similar complementary input strength differences of contralateral CA3 (CA3a, CA3b, and CA3c) inputs to proximal CA1, intermediate CA1, and distal CA1, respectively. C, Opposing connectivity gradients seen for canonical medial entorhinal (MEC) and lateral entorhinal cortex (LEC) inputs to CA1. A quantitative summary shows input strength differences of LEC (gradually increasing along the proximal-distal axis) versus MEC (gradually decreasing along the proximal distal axis) to proximal CA1, intermediate CA1, and distal CA1, respectively. The data are presented as mean ± SE; *, **, and *** indicate the statistical significance levels of p < 0.05, 0.01, and 0.001 respectively. D, Opposing connectivity gradients seen for noncanonical subiculum (increase along the proximal-distal axis) to CA1 versus presubiculum (decrease along the proximal-distal axis) to CA1. A quantitative summary of connectivity strengths of the subiculum versus the presubiculum/parasubiculum to proximal CA1, intermediate CA1, and distal CA1 is shown. The data are presented as mean ± SE; * and *** indicate the statistical significance levels of p < 0.05 and 0.001, respectively. E, Laminar distribution of CA1-projecting subicular neurons after rabies tracing from distal CA1, intermediate CA1, and proximal CA1. The bar graph is plotted as the percentage of total labeled subicular neurons in each case. Pol, polymorphic layer; PCL, pyramidal cell layer; ML, molecular layer. The data are presented as mean ± SE; * and *** indicate the statistical significance levels of p < 0.05 and 0.001, respectively. See Table 1-1 for detailed statistical comparison results.

