
Figure 4.
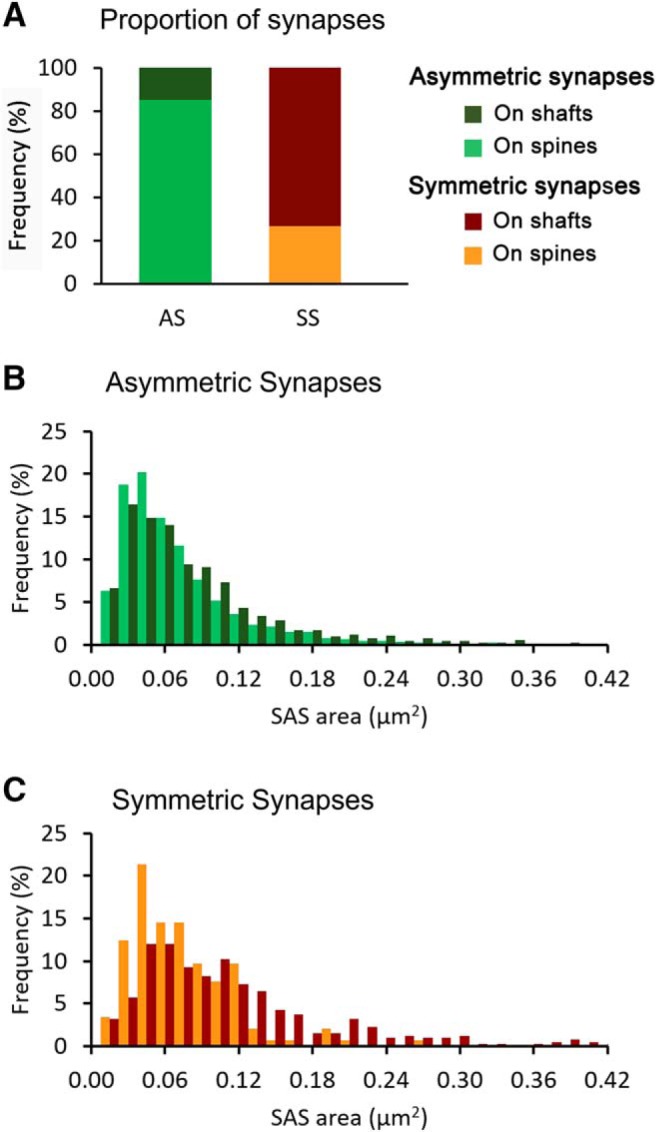
SAS areas of synapses on dendritic spines and shafts. A, Proportions of AS and SS on dendritic spines and shafts. B, Frequency histograms of SAS areas of AS on dendritic spines (light green) and on dendritic shafts (dark green). C, Frequency histograms of SAS areas of SS on dendritic spines (orange) and on dendritic shafts (dark orange). Frequencies in B, C have been normalized for each individual category.