
Figure 7.
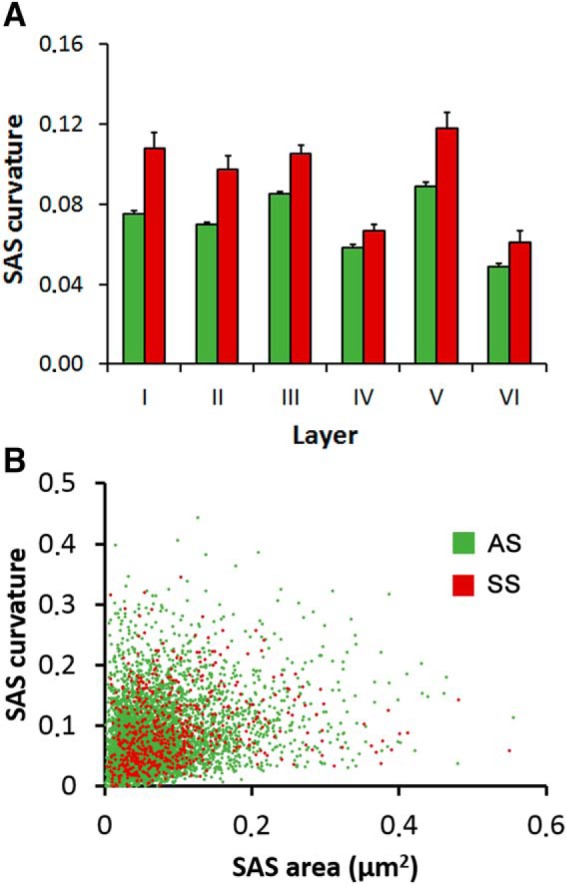
Curvature of the SAS. A, SAS curvature of AS and SS in the six cortical layers (mean ± SEM). SAS curvature was larger for SS (red bars) than for AS (green bars) in all layers. For AS, statistically significant differences were found between all layers (MW tests <0.05) except between Layers I and II (MW test, p = 0.325) and Layers III and V (MW test, p = 0.14). Curvature differences between SS were found between Layers IV and VI and all the other layers (MW tests, p < 0.001). B, Scatter plot representing the relationship between SAS curvature and area of AS (green dots) and SS (red dots). There was no correlation between SAS area and curvature for AS or SS (R2 = 0.08 for AS; R2 = 0.03 for SS).