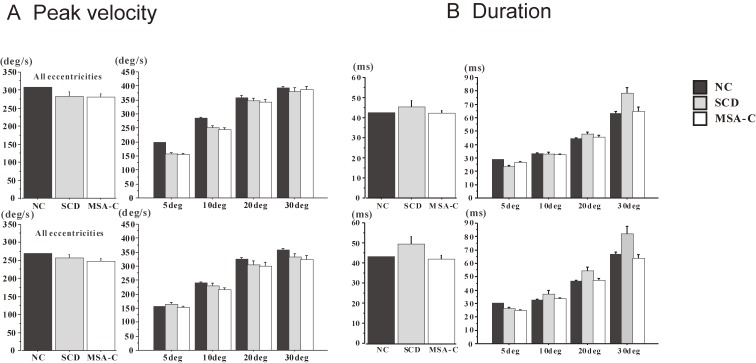
Figure 11.
Comparison of peak velocity and duration of saccades among normal subjects, spinocerebellar degeneration (SCD) patients, and cerebellar type of multiple system atrophy (MSA-C) patients. Peak velocity (A) and duration of saccades (deceleration period, B) are shown for normal control (NC) subjects, SCD patients, and MSA-C patients, for all target eccentricities (left of each figure), and separately at different target eccentricities (right of each figure, 5, 10, 20, and 30 degrees). Error bars denote standard errors. Black bars: NC, gray bars: SCD, white bars: MSA-C. Reproduced and modified with permission from Terao et al.124)

