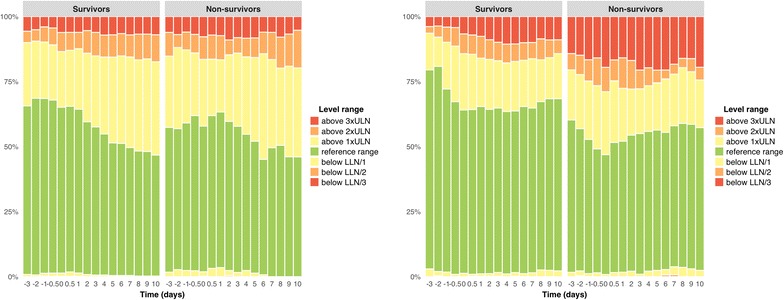
Fig. 4.

a AP level range over time; b bilirubin level range over time. Evolution of the proportion of survivors and non-survivors with alkaline phosphatase (left) and bilirubin (right) levels within and outside the reference range. T-ASTmax is designated as time 0. AP alkaline phosphatase, LLN lower limit of normal, ULN upper limit of normal
