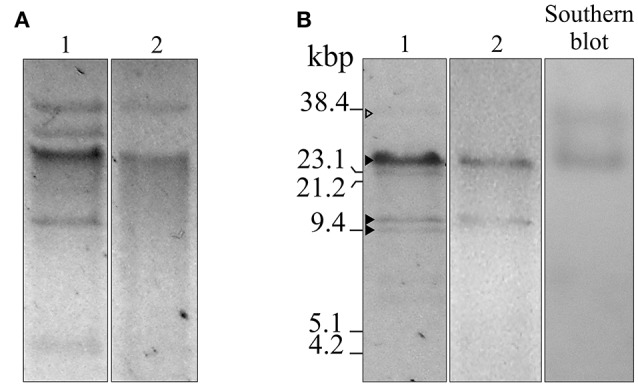
Figure 1.

Agarose gel electrophoresis, S1 nuclease, and Southern blot analyses of plasmids isolated from A. baumannii Ab242 and A. nosocomialis M2 transformed with Ab242 plasmids. (A) Gel electrophoresis (0.7% agarose)/ethidium bromide staining of total plasmids extracted from Ab242 cells (lane 1) and A. nosocomialis M2 cells transformed with Ab242 plasmids (lane 2). (B) Ab242 total plasmids were treated with S1 nuclease (lane 1) and plasmids extracted from A. nosocomialis M2 cells transformants were treated with BamHI (lane 2), both analyzed by agarose gel electrophoresis/ethidium bromide staining. The gels from lane 1 were capillary transferred to nitrocellulose membranes and subjected to a Southern blot analysis using a 689-bp biotin-labeled blaOXA-58 probe (lane 3). The three closed arrowheads at the left margin indicate, from top to bottom, discrete DNA bands obtained after S1 nuclease digestion of sizes of around 25, 12, and 9 kbp, respectively. The open arrowhead at the top points to faint band of a larger size. The final positions of the size markers (38.4 kbp SacI-digested pLD209 plasmid, Marchiaro et al., 2014; plus lambda DNA digested with EcoRI and HindIII) are indicated at the left margin.
