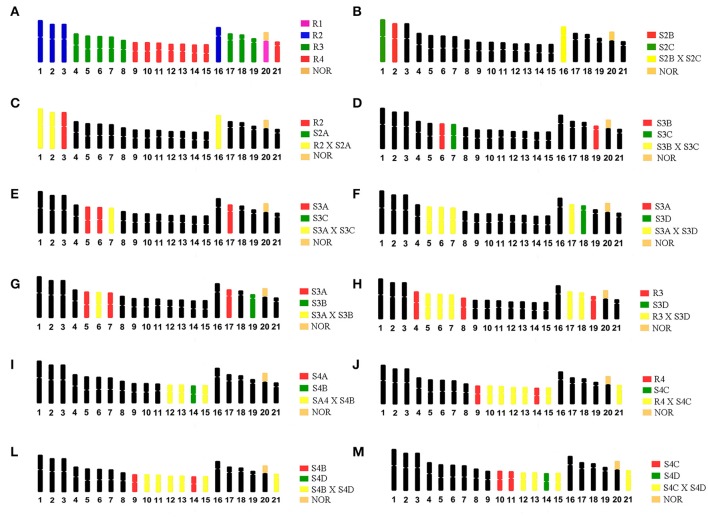
Figure 2.
Ideograms of the karyotype of G. carapo (2n = 42) representing: (A) The four chromosome regions (R1, R2, R3, R4) obtained by Nagamachi et al. (2010). (B–M) Dual – color FISH experiments based on Nagamachi et al. (2010, 2013), to identify chromosomal homology with GCA (2n = 42). S2A, S2B, and S2C represents sub-regions (A–C) within region 2; S3A, S3B, S3C, and S3D represents sub-regions (A–D) within region 3; S4A, S4B, S4C, and S4D represents sub-regions (A–D) within region 4.

