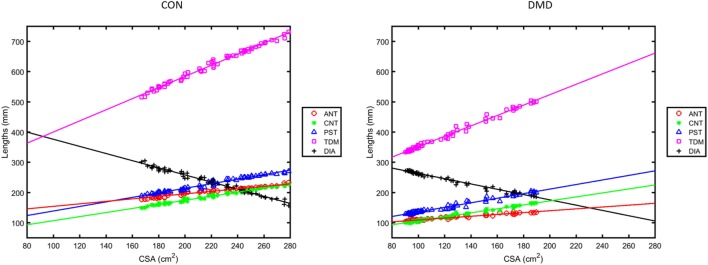
Figure 4.
Regression plots of the lengths ANT, CNT, PST, total distance of motion (TDM) and diaphragm length (DIA) versus lung cross-sectional area (CSA) measured from the sagittal images during deep breathing for the same two representative subjects as in Figures 1 and 3 [left: a control; right: a Duchenne muscular dystrophy (DMD) patient].

