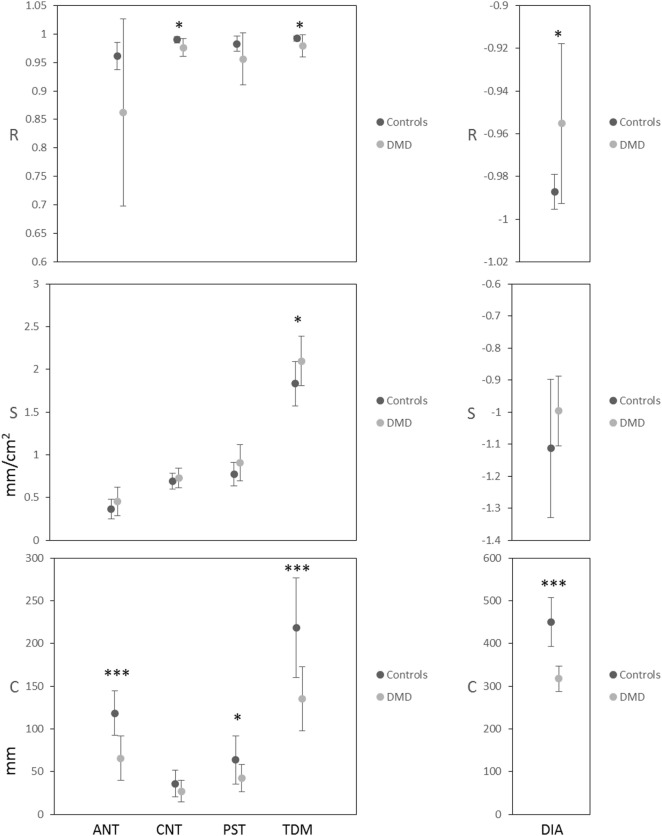
Figure 5.
Mean and SD of the correlation coefficient (R: top row), the slope (S: middle row) and the y-axis intercept (C: bottom row) of the linear regressions for lung cross-sectional area (CSA) versus each of the length measures ANT, CNT, PST, total distance of motion (TDM) and diaphragm length at baseline. P-values for the two-sample t-tests, comparing controls to Duchenne muscular dystrophy (DMD), are indicated as ***P ≤ 0.001, **P ≤ 0.01, *P ≤ 0.05.

