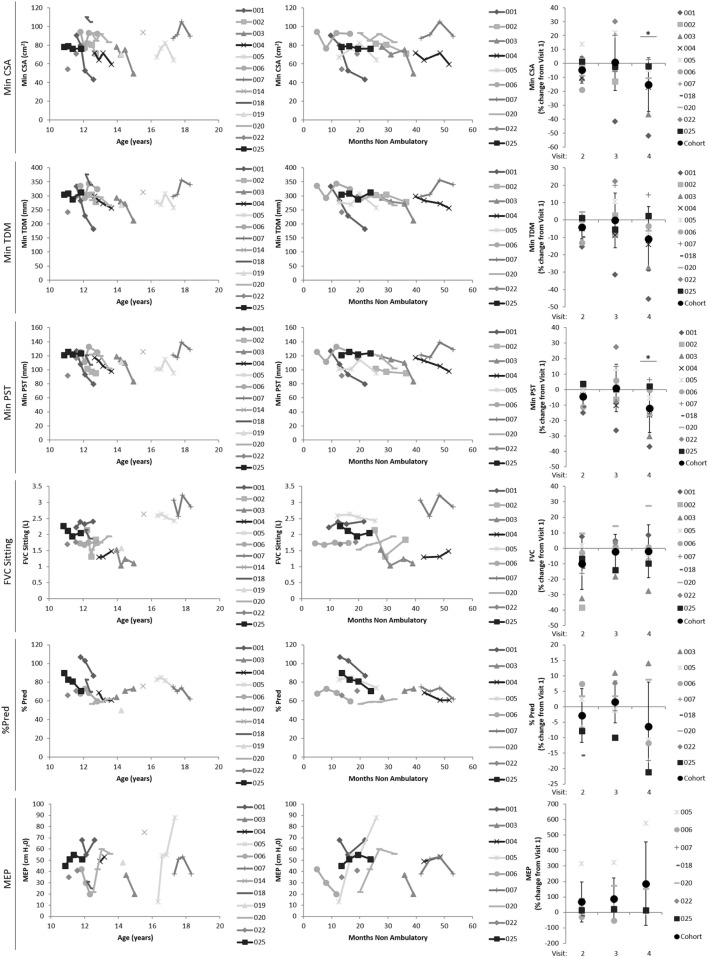
Figure 6.
Plots showing how a subset of the Magnetic Resonance Imaging-derived summary measures (min CSA, top row; min TDM, second row; max TDM, third row) and spirometry metrics (FVC, fourth row; %Pred, fifth row; and MEP, last row) relate to the disease progression surrogates of age (left plots) and months non-ambulatory (middle plots), as well as follow-up visit (right plots). Min CSA, minimum lung cross-sectional area; min/max TDM, minimum/maximum total distance of motion (TDM) of the diaphragm; FVC, forced vital capacity; %Pred, FVC as a percentage of predicted normal values; MEP, maximal expiratory pressure.

