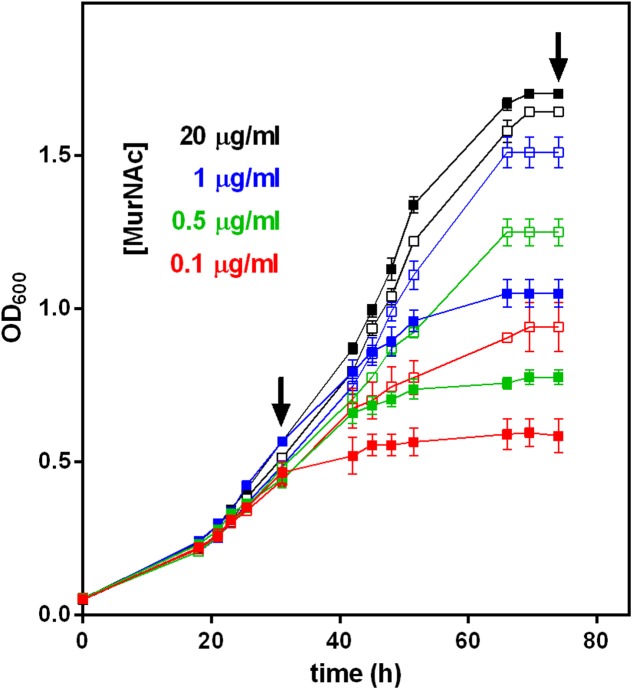
FIGURE 4.
Growth of T. forsythia WT and ΔTf_murK::erm mutant in the presence of different MurNAc concentrations. The OD600 of cultures of T. forsythia WT (solid symbols) and ΔTf_murK::erm mutant (open symbols) was measured (shown are the mean values of triplicates and standard error) and contained MurNAc in concentrations indicated (color-coded). Arrows indicate the time points referred to as exponential and stationary phase, at which metabolite accumulation and cell morphology was analyzed (see Figures 5, 6).

