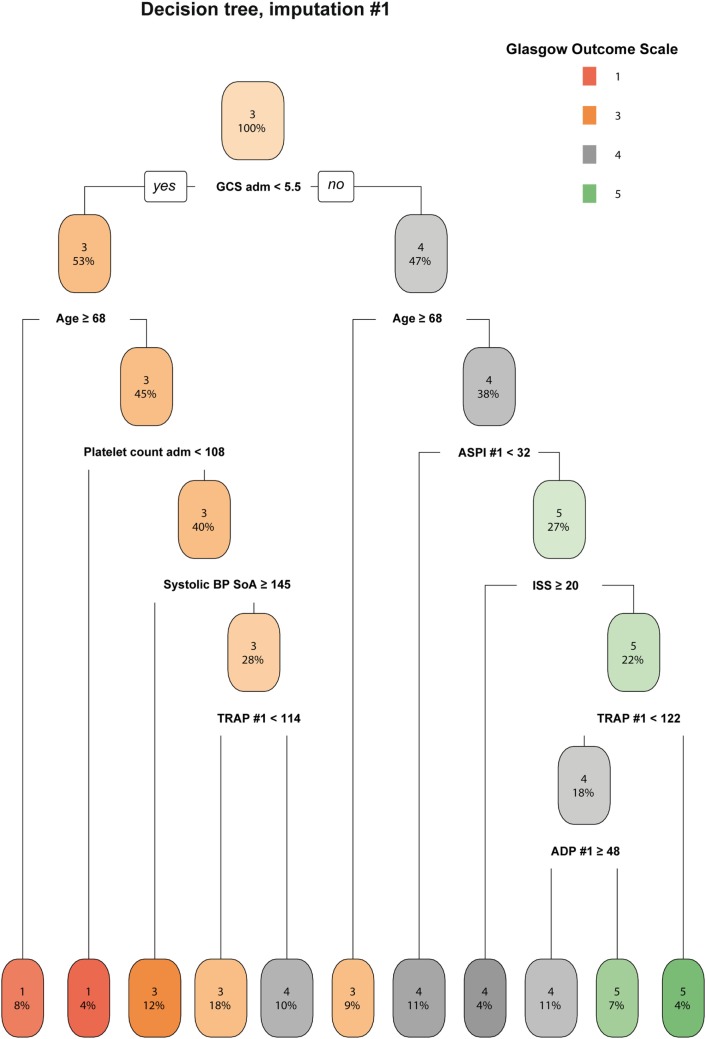
Figure 3.
A decision tree for determining the importance of ASPI. A representative imputation of one of the decision trees is depicted. Each node in the tree denotes the predicted GOS value (indexed by color and GOS category number), followed by the percentage of patients belonging in each node. While moving downwards in the tree, GOS changes depending on the independent variables and the percentages of patients who pertain to the stipulated criteria decrease accordingly. Consistent across all imputations, ASPI values in the range of 32–68 affected the determination of Glasgow Outcome Scale (GOS) 4–5 among younger patients with higher GCS (only one imputation shown). Radiologic score was defined as the Stockholm CT score (19). Data values are presented in the same units as can be found in Tables 1 and 2, respectively. Abbreviations: adm, admission; ADP, P2Y12 receptor; ASPI, arachidonic acid receptor; BP, blood pressure; GCS, Glasgow Coma Scale; ISS, Injury Severity Score; SoA, scene of accident; TRAP, thrombin receptor; #, ordered number of sample; GOS, Glasgow Outcome Scale.

