
Fig. 1.
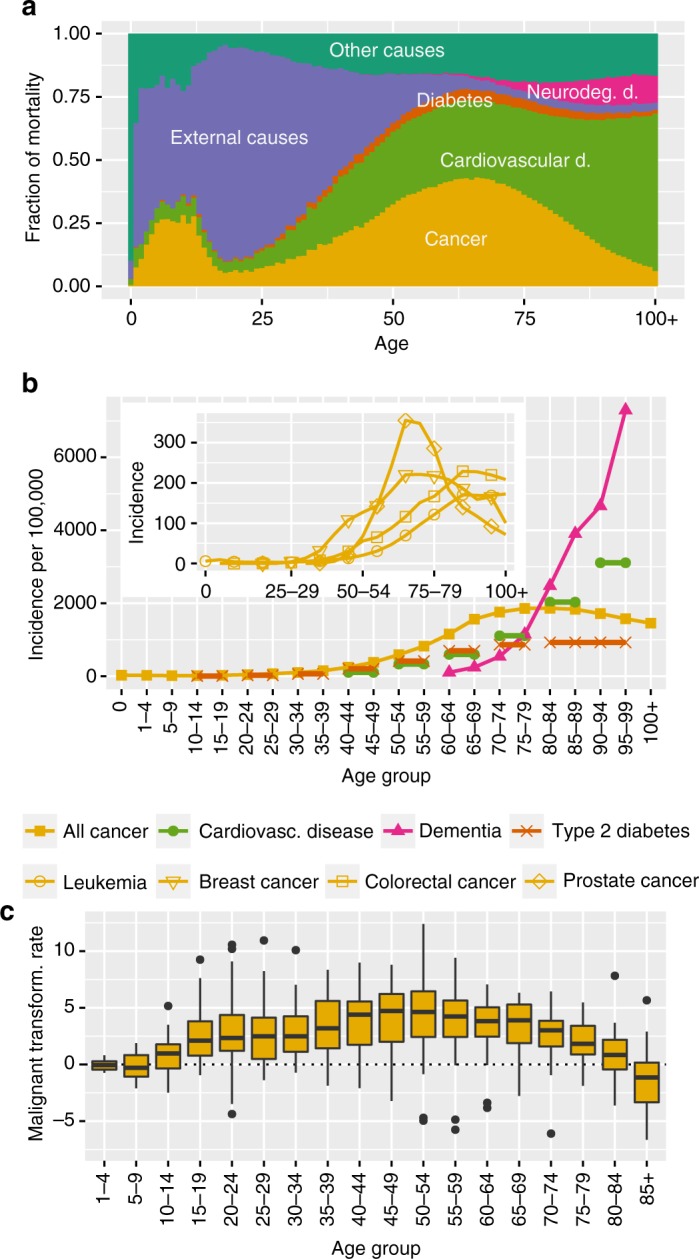
Epidemiology of ageing-associated diseases. a Contribution of different disease categories to total human mortality (Supplementary Note 1). b First diagnosis (incidence) of ageing-associated diseases and several cancer types (inset) across age groups. Lines across several age groups indicate cases in which only data combining several age groups was available (Supplementary Note 1). c Malignant transformation rates across 34 types of cancer across age groups. The center line corresponds to the median, box limits to 25th and 75th percentiles and whiskers to 1.5 times the interquartile range