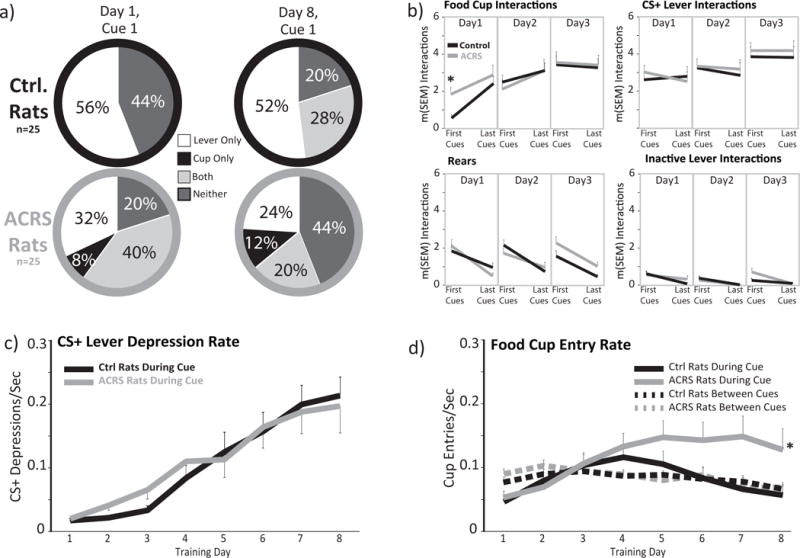
Figure 2. Acquisition of Sign and Goal Tracking to Food-Predictive Cues.

a) the percentage of rats in control (top row) and ACRS (bottom row) that interacted with the lever cue only (white), cup only (black), both lever and cup (light grey), or neither stimulus (dark grey) on the first ever lever extension on sign/goal tracking training day 1 (left column), or the first cue presentation on the 8th training day (right column). b) In each panel, m+SEM hand-scored interactions with the food cup (top left), cue lever (top right), or inactive lever (bottom right), or rears (bottom left) are shown during the first 5, or last 5 cue presentations on sign/goal tracking training days 1, 2, and 3. *p<0.05, interaction of ACRS × cue block. c) m+SEM rate of CS+ lever depressions (depressions/sec) on each training day in control (black line) and ACRS rats (grey line). d) m+SEM rate of food cup entries during cues (solid black, grey lines) or in non-cue periods (dashed black, grey lines). *p<0.05, ACRS group × day interaction.
