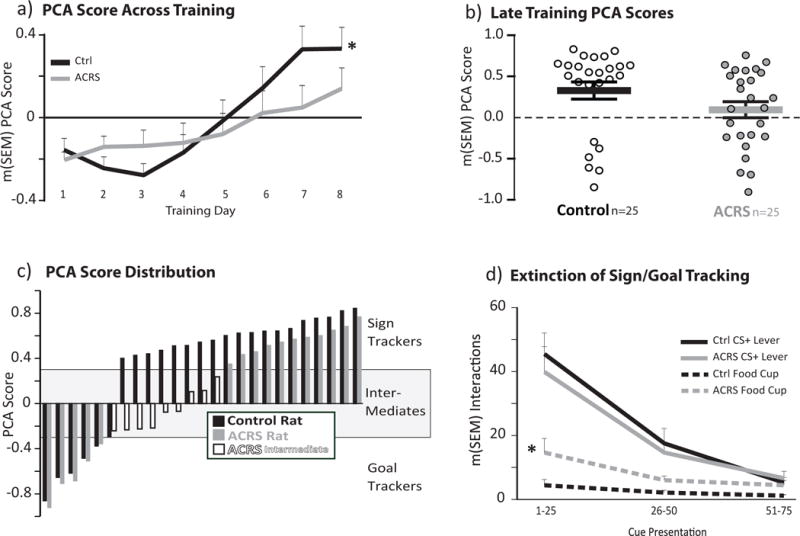
Figure 3. Cue Preference in ACRS and Control Rats.

a) Pavlovian Conditioned Approach (PCA) score across training days. Black line=control, grey line=ACRS. Positive values indicate bias toward the CS+ lever (sign tracking), negative values indicated bias toward food cup (goal tracking) *p<0.05, group × day interaction. b) Mean+SEM PCA Score on training days 7&8 show with black (control) or grey (ACRS) horizontal lines and error bars. Individual rats’ data are represented with white or grey circles. c) Rat-by-rat PCA scores, ranked from most negative to most positive. Control rats=black bars, ACRS rats=grey bars, ACRS rats defined as intermediates (PCA<0.3 and >−0.3)=white bars). d) CS+ lever (solid black, grey lines) and during cue food cup entries (dashed black, grey lines) emitted during the first, second, or third 25-cue blocks on sign/goal tracking extinction training test. * p<0.05, Main effect of ACRS on food cup entries.
