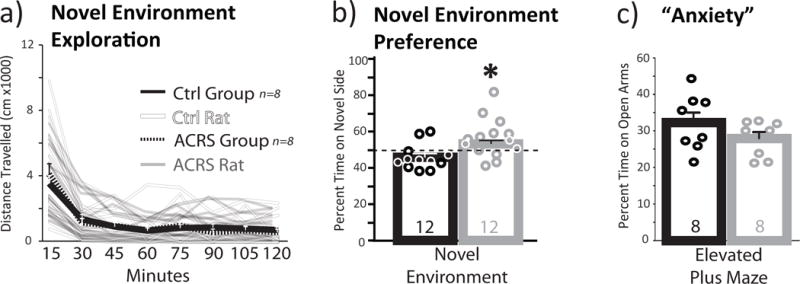
Figure 5. ACRS Effects on Novelty Induced Locomotion and Novel Environment Preference.

a) m+SEM Distance traveled on a 1h novel environment locomotion test is shown in 15min bins for control (black line; individual rats shown with faded black lines) and ACRS rats (m+SEM=dashed line, individual rats shown with faded white lines). b) In a novel environment preference test, ACRS rats (grey bar; circles represent individual rats) spent a greater percentage of the session time on the novel side than controls (black bar; circles represent individual rats). c) In an elevated plus maze task, percent of session time spent on the open arms of the apparatus, an index of anxiety, is shown. Group size shown in bars. *p<0.05, vehicle versus ACRS. Group ns shown in bars.
