
Figure 6. ACRS and Food Restriction Effects on Brain Endocannabinoid Levels.
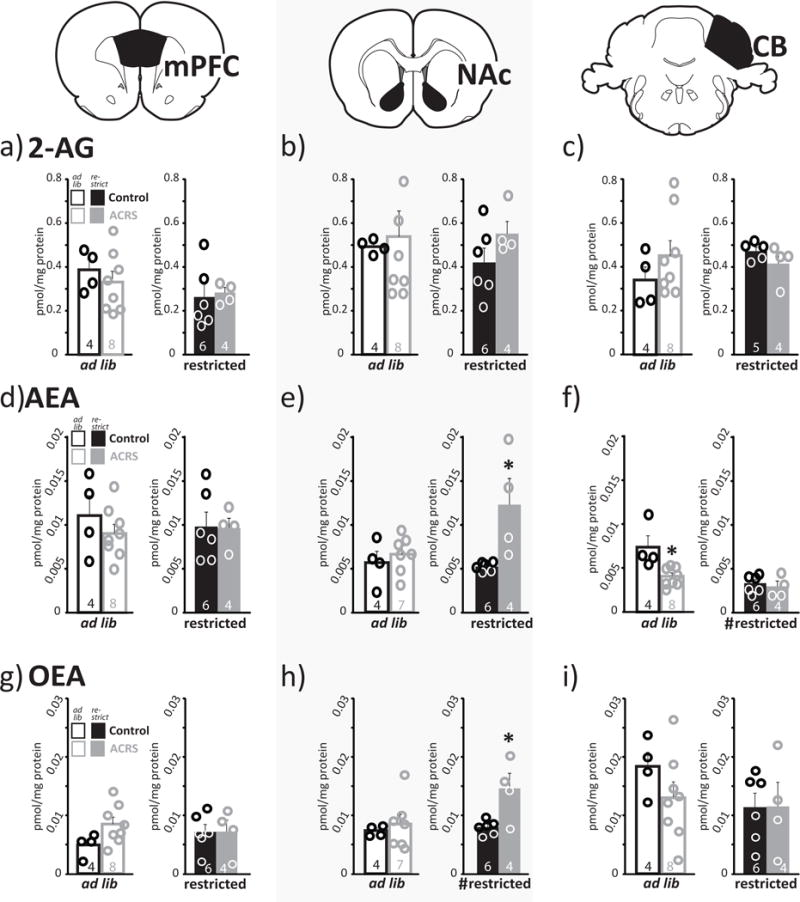
m+SEM levels of a–c) 2-AG, d–f) AEA, or g–i) OEA observed in a,d,g) medial prefrontal cortex, b,e,h) nucleus accumbens, or c,f,i) cerebellum are shown in ad libitum fed rats (left panels; white bars; circles represent individual rats) or food restricted rats (right panels; solid bars; circles represent individual rats). Control rats are represented with black borders or filled bars, ACRS rats represented with grey bordered or filled bars. ECB levels in dissected samples normalized by protein content in sample. Sample size shown in bars. *p<0.05, main effect of ACRS/control. #p<0.05, main effect of restriction