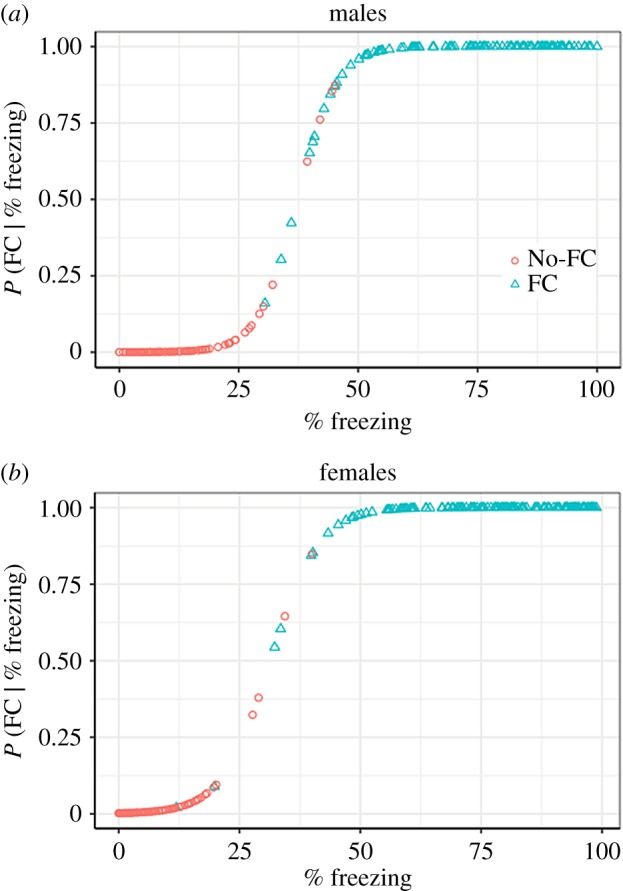
Figure 2.

Expected probability of having undergone fear conditioning as a function of freezing for each individual. (a) The shape of the function for males shows that the probability of fear conditioning (Y-axis) changes rapidly as one moves away from the 37.3% freezing mark (X-axis). (b) For females, the optimal point for minimizing overlap between the two distributions was at 31.4% freezing. For the females, much like was the case for the males, there was very little overlap between the distributions. These graphs show the predictions of the logistic models described in Study 1, with the actual history of fear conditioning indicated by colour and shape. (Online version in colour.)
