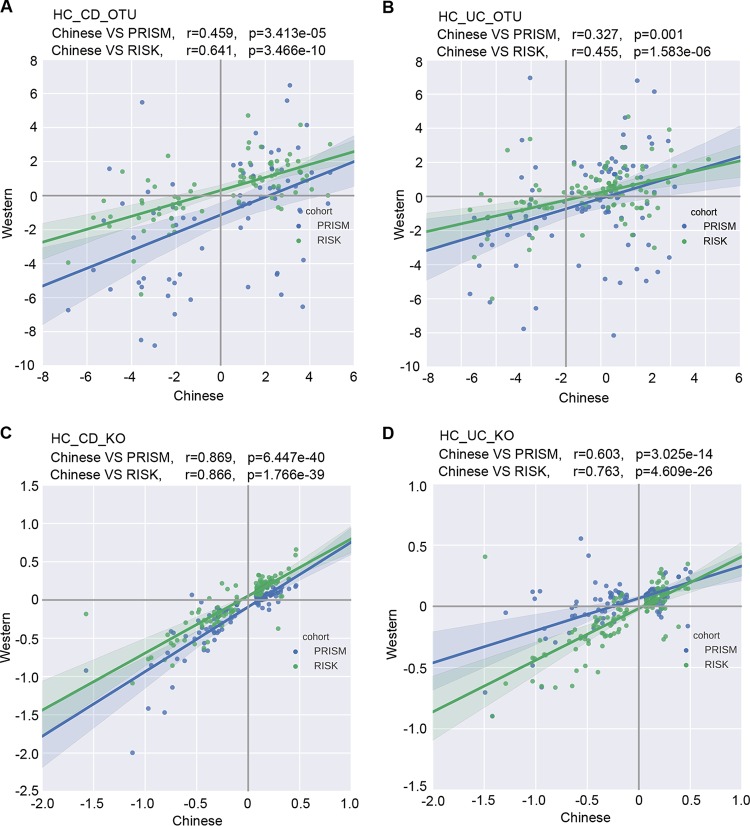
FIG 2 .
The similar shifts of gut microbiota in IBD across cohorts. Comparisons of OTUs (A and B) and predicted KOs (C and D) differentiated between healthy controls and subjects with IBD in the current study and the RISK and PRISM cohorts with biopsy samples. Each dot represents an OTU or KO that differed significantly between healthy and disease samples in Chinese cohorts. Axes indicates the log2-fold changes of the levels of these OTU/KO abundances between subjects with disease and healthy individuals in the Chinese cohort (x axis) and the Western cohorts (y axis), with the RISK cohort indicated in green and the PRISM cohort in blue. The correlation coefficients and the P values determined from comparisons between the cohorts are labeled on the plot.

