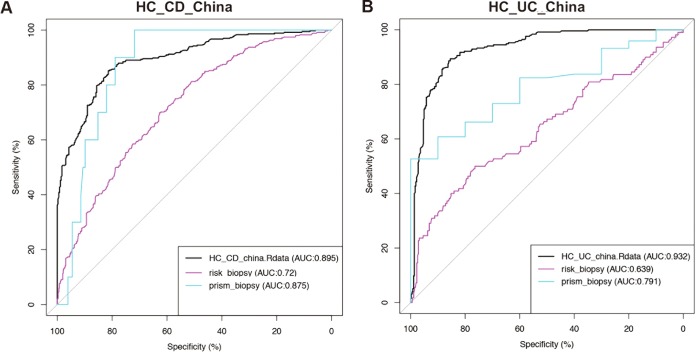
FIG 3 .
Gut microbiotas distinguish diseases from health similarly across cohorts. The black ROC curve indicates the accuracy of the classification model built on the Chinese cohort for classifying HC versus CD (A) and HC versus UC (B). Colored curves are the classification accuracies when these models are applied to the other cohorts.

