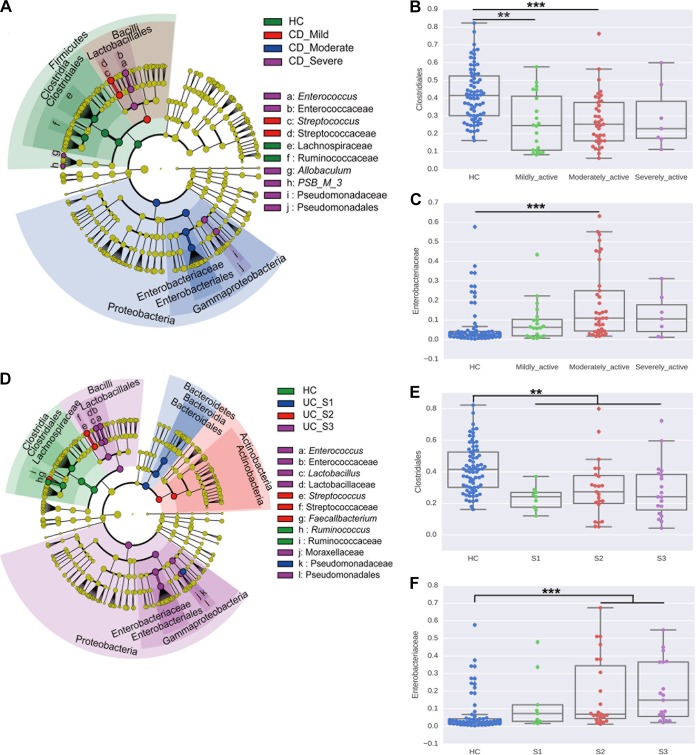
FIG 4 .
Bacterial biomarkers associated with disease severity. (A) Cladogram representing taxa with different abundances for CD activity. The size of each circle is proportionate to the abundance of the taxon. (B and C) Relative abundances of Clostridiales (B) and Enterobacteriaceae (C) in CD activity groups are shown. (D) Cladogram representing taxa with different abundances for UC activity. (E and F) Relative abundances of Clostridiales (E) and Enterobacteriaceae (F) in UC activity groups are shown. The statistical significance was determined with the Wilcoxon test and was adjusted using the false-discovery rate (FDR). **, P value < 0.01; ***, P value < 0.001.

