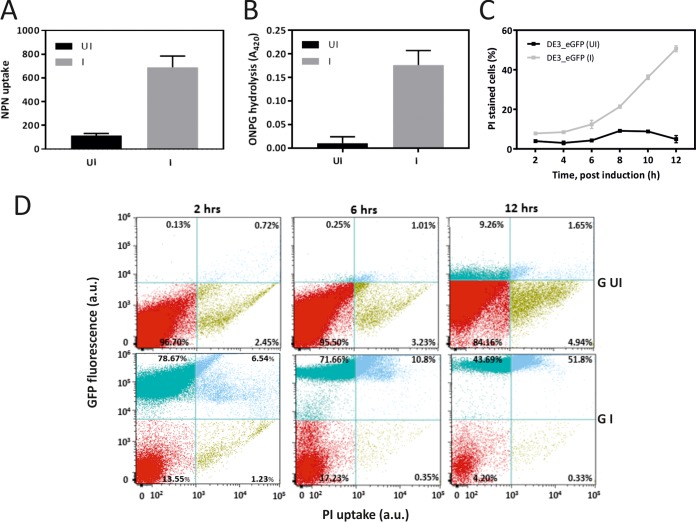
FIG 2 .
Permeability of the IM and OM of E. coli BL21(DE3)pET-GOI during growth. (A) OM permeability (NPN uptake) analysis in the absence (black) and presence (gray) of AcDKR expression. (B) IM permeability (ONPG hydrolysis) analysis in the absence (dark) and presence (gray) of eGFP expression. (C) Cell permeability (PI uptake) analysis over time in the absence (black) and presence (gray) of eGFP expression. (D) FACS density plots of eGFP expression and PI uptake of cells expressing (GI, bottom) or not expressing (G UI, top) eGFP over time. UI and I, no addition and addition of 250 µM IPTG, respectively. Data represent mean values ± the standard errors from independent biological experiments. a.u., arbitrary units.

