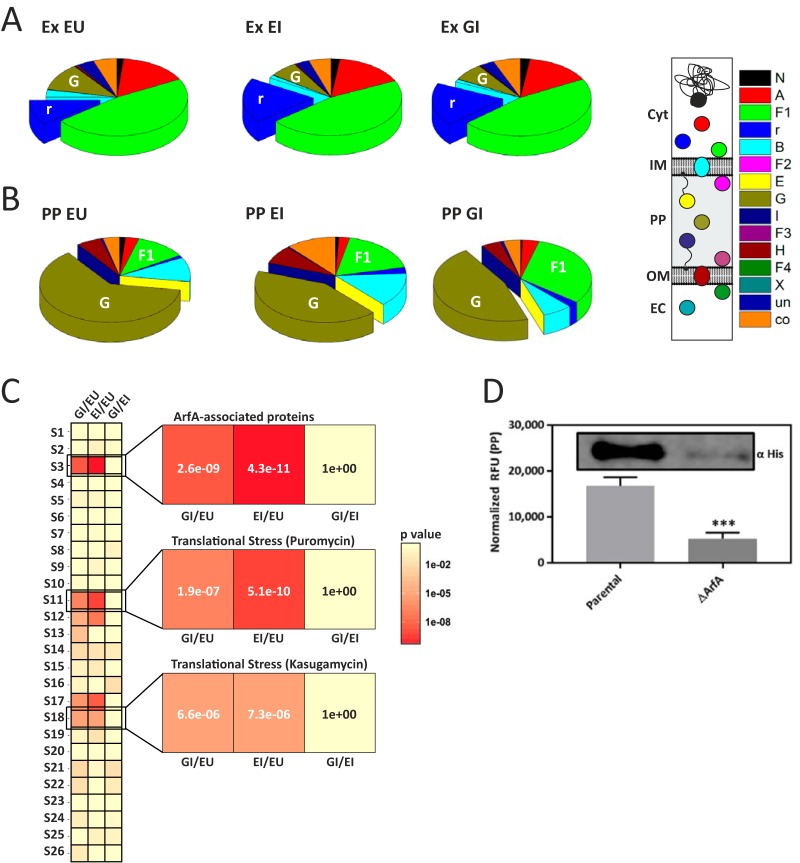
FIG 5 .
Relative protein abundance with subcellular topological annotation and signature response heat map analysis. (A and B) Relative protein abundance for extract (A) and periplasm (B) clustered by subcellular topology in BL21(DE3)pET-NusA in the absence (EU) or presence (EI) of IPTG and in BL21(DE3)pET-eGFP in the presence of IPTG (GI). N, nucleoid associated; r, ribosomal; A, cytoplasmic; F1, peripherally associated with the IM facing the cytoplasm; B, integral IM proteins; F2, peripherally associated with the IM facing the periplasm; E, IM lipoproteins; G, periplasmic; I, OM lipoproteins; F3, peripherally associated with the OM facing the periplasm; H, integral OM proteins; F4, peripherally associated with the OM facing the extracellular space; X, extracellular space; un, unassigned; co, coannotated. (C) Enrichment analysis of upregulated proteome against stress response signatures S1 to S26 (Table S3) with expanded views of ArfA-associated proteins (S3) (36) and puromycin (S11) and kasugamycin (S18) treatments (37). (D) Periplasmic localization of eGFP in parental and ArfA-deficient (ΔarfA) BL21(DE3) confirmed by Western analysis (inset, representative of three biological replicates). Panels A and B, subcellular topology annotation (STEPdb) (34). Panel C, enrichment analysis performed by the iGA method. P values were corrected for multiple testing by the Bonferroni method. In panel D, the data are the mean value ± the standard deviation of at least three biological replicates. *, P < 0.05; ***, P < 0.001; ****, P < 0.0001 (two-way ANOVA followed by Dunnett’s multiple-comparison test).

