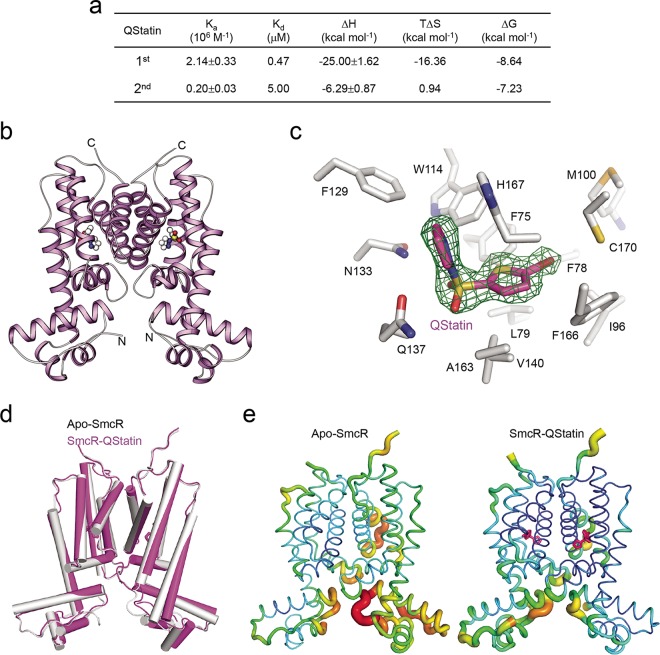
FIG 3 .
QStatin binds to the putative ligand-binding pocket of SmcR. (a) ITC analysis showing that QStatin binds directly to SmcR with high affinity. Data are representative of two experiments with similar results. Ka, absorption rate constant. (b) Structure of the SmcR-QStatin complex. QStatin is represented by a ball-and-stick model. (c) Electron density difference map showing QStatin bound within the putative ligand-binding pocket of SmcR. The Fo-Fc map was calculated before the inclusion of QStatin and is contoured at 3.0 σ. The SmcR residues involved in the interaction with QStatin are represented by white sticks. (d) Superimposition of the apo-SmcR and SmcR-QStatin complexes. (e) QStatin reduces the flexibility of SmcR. The structures of apo-SmcR and SmcR-QStatin were compared according to their B-factor values. High and low B-factors are represented by dark and light colors, respectively. QStatin is represented by magenta sticks.

